Bahamian vs Creek 4th Grade
COMPARE
Bahamian
Creek
4th Grade
4th Grade Comparison
Bahamians
Creek
97.2%
4TH GRADE
3.8/ 100
METRIC RATING
226th/ 347
METRIC RANK
98.1%
4TH GRADE
99.8/ 100
METRIC RATING
58th/ 347
METRIC RANK
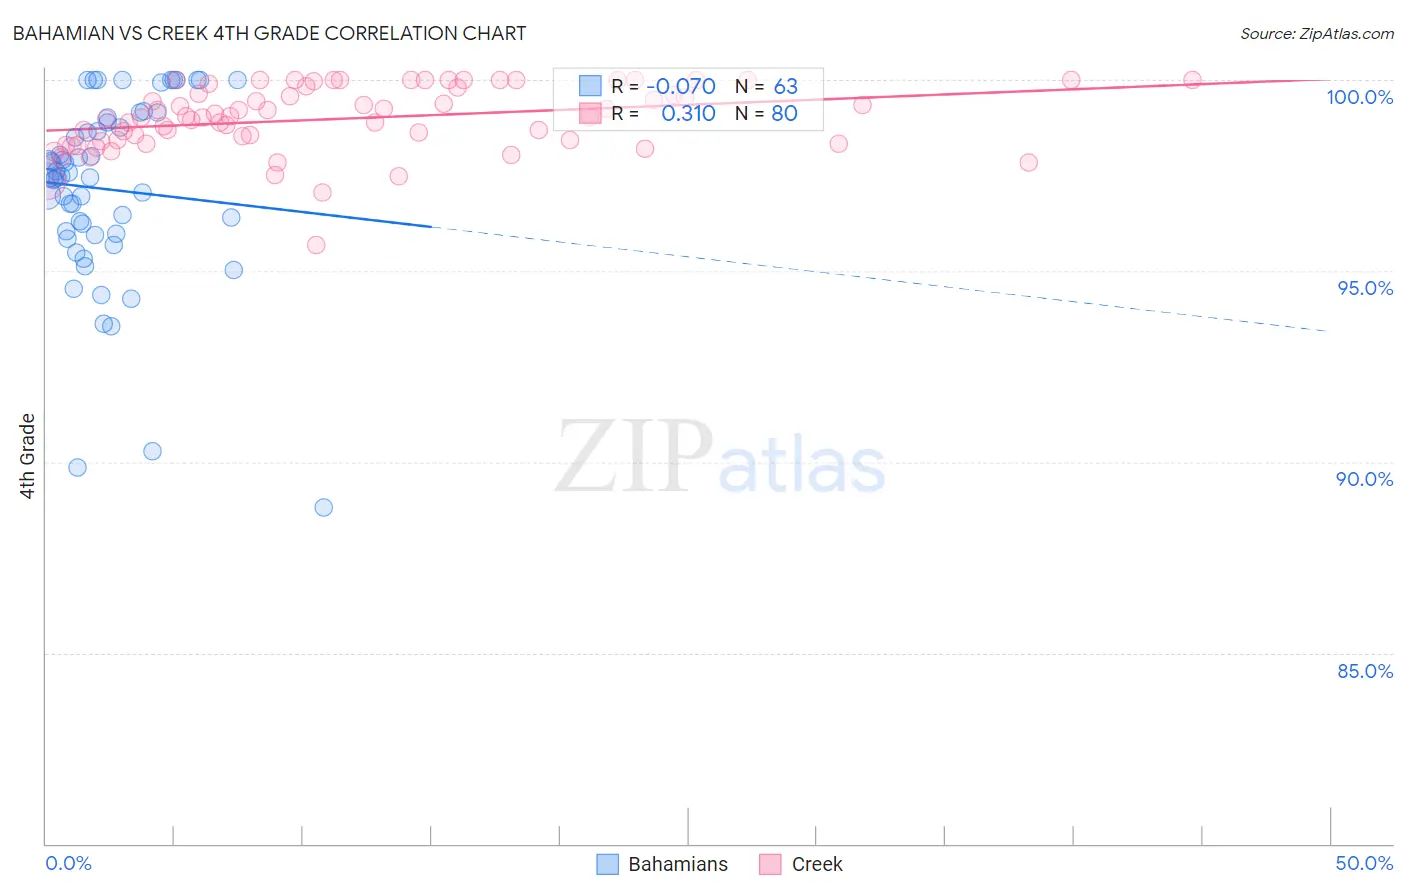
Bahamian vs Creek 4th Grade Correlation Chart
The statistical analysis conducted on geographies consisting of 112,698,819 people shows a slight negative correlation between the proportion of Bahamians and percentage of population with at least 4th grade education in the United States with a correlation coefficient (R) of -0.070 and weighted average of 97.2%. Similarly, the statistical analysis conducted on geographies consisting of 178,480,663 people shows a mild positive correlation between the proportion of Creek and percentage of population with at least 4th grade education in the United States with a correlation coefficient (R) of 0.310 and weighted average of 98.1%, a difference of 0.88%.
4th Grade Correlation Summary
| Measurement | Bahamian | Creek |
| Minimum | 88.8% | 95.7% |
| Maximum | 100.0% | 100.0% |
| Range | 11.2% | 4.3% |
| Mean | 97.1% | 99.0% |
| Median | 97.4% | 99.0% |
| Interquartile 25% (IQ1) | 96.0% | 98.4% |
| Interquartile 75% (IQ3) | 98.9% | 99.8% |
| Interquartile Range (IQR) | 2.9% | 1.4% |
| Standard Deviation (Sample) | 2.4% | 0.86% |
| Standard Deviation (Population) | 2.4% | 0.85% |
Similar Demographics by 4th Grade
Demographics Similar to Bahamians by 4th Grade
In terms of 4th grade, the demographic groups most similar to Bahamians are Immigrants from Pakistan (97.2%, a difference of 0.0%), Subsaharan African (97.2%, a difference of 0.010%), Liberian (97.2%, a difference of 0.010%), Uruguayan (97.2%, a difference of 0.010%), and Immigrants from Malaysia (97.2%, a difference of 0.010%).
| Demographics | Rating | Rank | 4th Grade |
| Tongans | 5.8 /100 | #219 | Tragic 97.3% |
| South American Indians | 5.5 /100 | #220 | Tragic 97.3% |
| Immigrants | Panama | 5.4 /100 | #221 | Tragic 97.3% |
| Immigrants | Lebanon | 5.1 /100 | #222 | Tragic 97.3% |
| Immigrants | Sudan | 5.0 /100 | #223 | Tragic 97.2% |
| Immigrants | Syria | 5.0 /100 | #224 | Tragic 97.2% |
| Immigrants | Iraq | 4.6 /100 | #225 | Tragic 97.2% |
| Bahamians | 3.8 /100 | #226 | Tragic 97.2% |
| Immigrants | Pakistan | 3.7 /100 | #227 | Tragic 97.2% |
| Sub-Saharan Africans | 3.6 /100 | #228 | Tragic 97.2% |
| Liberians | 3.6 /100 | #229 | Tragic 97.2% |
| Uruguayans | 3.5 /100 | #230 | Tragic 97.2% |
| Immigrants | Malaysia | 3.4 /100 | #231 | Tragic 97.2% |
| Immigrants | Western Asia | 3.4 /100 | #232 | Tragic 97.2% |
| Senegalese | 3.1 /100 | #233 | Tragic 97.2% |
Demographics Similar to Creek by 4th Grade
In terms of 4th grade, the demographic groups most similar to Creek are Greek (98.1%, a difference of 0.0%), Austrian (98.1%, a difference of 0.0%), Australian (98.1%, a difference of 0.010%), Slavic (98.1%, a difference of 0.010%), and Maltese (98.1%, a difference of 0.010%).
| Demographics | Rating | Rank | 4th Grade |
| Celtics | 99.8 /100 | #51 | Exceptional 98.1% |
| Australians | 99.8 /100 | #52 | Exceptional 98.1% |
| Slavs | 99.8 /100 | #53 | Exceptional 98.1% |
| Maltese | 99.8 /100 | #54 | Exceptional 98.1% |
| Whites/Caucasians | 99.8 /100 | #55 | Exceptional 98.1% |
| Greeks | 99.8 /100 | #56 | Exceptional 98.1% |
| Austrians | 99.8 /100 | #57 | Exceptional 98.1% |
| Creek | 99.8 /100 | #58 | Exceptional 98.1% |
| Americans | 99.8 /100 | #59 | Exceptional 98.1% |
| Immigrants | Canada | 99.7 /100 | #60 | Exceptional 98.1% |
| Immigrants | North America | 99.7 /100 | #61 | Exceptional 98.1% |
| Serbians | 99.7 /100 | #62 | Exceptional 98.1% |
| Russians | 99.7 /100 | #63 | Exceptional 98.0% |
| Cajuns | 99.7 /100 | #64 | Exceptional 98.0% |
| Immigrants | Northern Europe | 99.6 /100 | #65 | Exceptional 98.0% |