Bahamian vs Pennsylvania German Median Family Income
COMPARE
Bahamian
Pennsylvania German
Median Family Income
Median Family Income Comparison
Bahamians
Pennsylvania Germans
$82,631
MEDIAN FAMILY INCOME
0.0/ 100
METRIC RATING
323rd/ 347
METRIC RANK
$91,763
MEDIAN FAMILY INCOME
0.4/ 100
METRIC RATING
260th/ 347
METRIC RANK
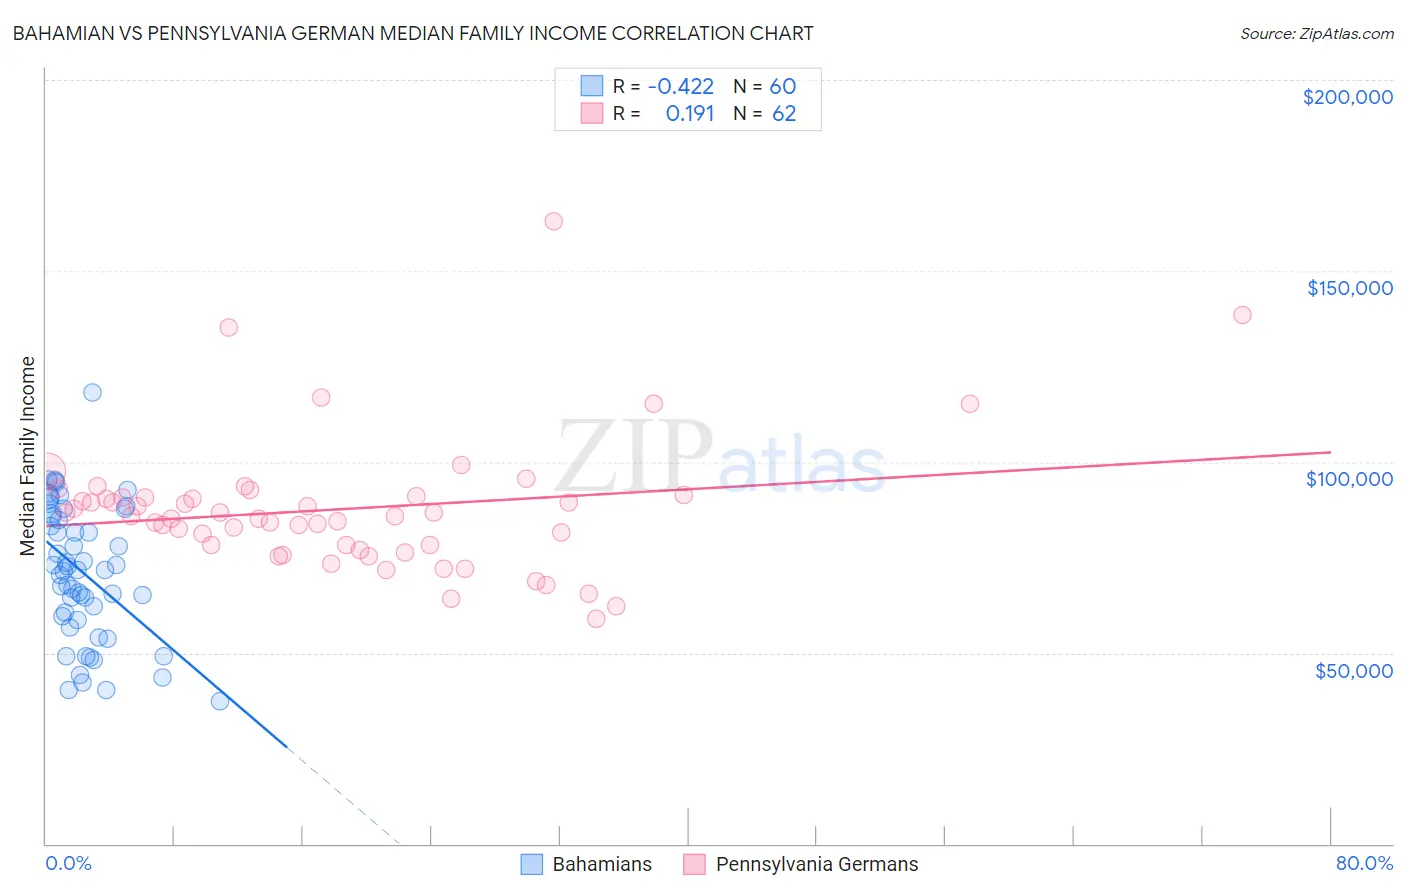
Bahamian vs Pennsylvania German Median Family Income Correlation Chart
The statistical analysis conducted on geographies consisting of 112,596,489 people shows a moderate negative correlation between the proportion of Bahamians and median family income in the United States with a correlation coefficient (R) of -0.422 and weighted average of $82,631. Similarly, the statistical analysis conducted on geographies consisting of 234,014,323 people shows a poor positive correlation between the proportion of Pennsylvania Germans and median family income in the United States with a correlation coefficient (R) of 0.191 and weighted average of $91,763, a difference of 11.1%.
Median Family Income Correlation Summary
| Measurement | Bahamian | Pennsylvania German |
| Minimum | $37,231 | $58,875 |
| Maximum | $118,067 | $162,917 |
| Range | $80,836 | $104,042 |
| Mean | $71,118 | $87,564 |
| Median | $71,812 | $85,824 |
| Interquartile 25% (IQ1) | $59,044 | $78,127 |
| Interquartile 75% (IQ3) | $86,176 | $90,788 |
| Interquartile Range (IQR) | $27,132 | $12,661 |
| Standard Deviation (Sample) | $17,647 | $17,527 |
| Standard Deviation (Population) | $17,499 | $17,385 |
Similar Demographics by Median Family Income
Demographics Similar to Bahamians by Median Family Income
In terms of median family income, the demographic groups most similar to Bahamians are Creek ($82,560, a difference of 0.090%), Sioux ($82,386, a difference of 0.30%), Dominican ($82,888, a difference of 0.31%), Immigrants from Congo ($82,216, a difference of 0.51%), and Arapaho ($82,064, a difference of 0.69%).
| Demographics | Rating | Rank | Median Family Income |
| Immigrants | Haiti | 0.0 /100 | #316 | Tragic $84,018 |
| Yakama | 0.0 /100 | #317 | Tragic $83,932 |
| Immigrants | Mexico | 0.0 /100 | #318 | Tragic $83,639 |
| Immigrants | Honduras | 0.0 /100 | #319 | Tragic $83,618 |
| Seminole | 0.0 /100 | #320 | Tragic $83,354 |
| Immigrants | Caribbean | 0.0 /100 | #321 | Tragic $83,319 |
| Dominicans | 0.0 /100 | #322 | Tragic $82,888 |
| Bahamians | 0.0 /100 | #323 | Tragic $82,631 |
| Creek | 0.0 /100 | #324 | Tragic $82,560 |
| Sioux | 0.0 /100 | #325 | Tragic $82,386 |
| Immigrants | Congo | 0.0 /100 | #326 | Tragic $82,216 |
| Arapaho | 0.0 /100 | #327 | Tragic $82,064 |
| Blacks/African Americans | 0.0 /100 | #328 | Tragic $81,912 |
| Dutch West Indians | 0.0 /100 | #329 | Tragic $81,852 |
| Cheyenne | 0.0 /100 | #330 | Tragic $81,385 |
Demographics Similar to Pennsylvania Germans by Median Family Income
In terms of median family income, the demographic groups most similar to Pennsylvania Germans are Inupiat ($91,730, a difference of 0.040%), Liberian ($91,722, a difference of 0.040%), Cape Verdean ($91,848, a difference of 0.090%), Osage ($91,926, a difference of 0.18%), and Immigrants from West Indies ($91,588, a difference of 0.19%).
| Demographics | Rating | Rank | Median Family Income |
| Immigrants | Guyana | 0.6 /100 | #253 | Tragic $92,513 |
| Immigrants | Barbados | 0.5 /100 | #254 | Tragic $92,419 |
| Immigrants | Laos | 0.5 /100 | #255 | Tragic $92,239 |
| Nicaraguans | 0.5 /100 | #256 | Tragic $92,231 |
| Americans | 0.4 /100 | #257 | Tragic $92,096 |
| Osage | 0.4 /100 | #258 | Tragic $91,926 |
| Cape Verdeans | 0.4 /100 | #259 | Tragic $91,848 |
| Pennsylvania Germans | 0.4 /100 | #260 | Tragic $91,763 |
| Inupiat | 0.4 /100 | #261 | Tragic $91,730 |
| Liberians | 0.4 /100 | #262 | Tragic $91,722 |
| Immigrants | West Indies | 0.3 /100 | #263 | Tragic $91,588 |
| Senegalese | 0.3 /100 | #264 | Tragic $91,475 |
| Hmong | 0.3 /100 | #265 | Tragic $91,296 |
| Central Americans | 0.3 /100 | #266 | Tragic $91,087 |
| Mexican American Indians | 0.2 /100 | #267 | Tragic $90,918 |