Salvadoran vs Arapaho Householder Income Under 25 years
COMPARE
Salvadoran
Arapaho
Householder Income Under 25 years
Householder Income Under 25 years Comparison
Salvadorans
Arapaho
$55,412
HOUSEHOLDER INCOME UNDER 25 YEARS
100.0/ 100
METRIC RATING
56th/ 347
METRIC RANK
$44,003
HOUSEHOLDER INCOME UNDER 25 YEARS
0.0/ 100
METRIC RATING
342nd/ 347
METRIC RANK
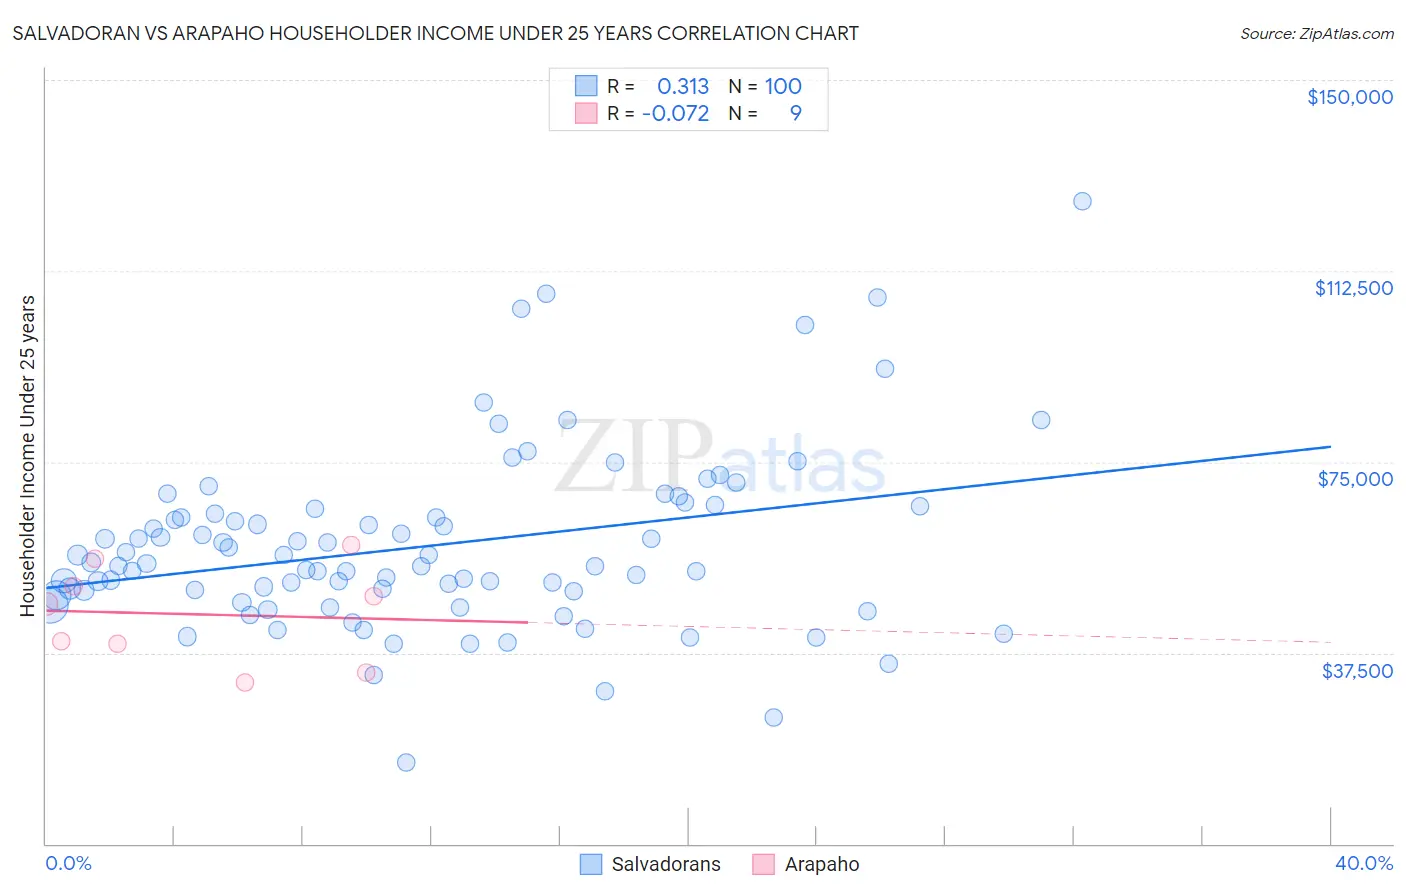
Salvadoran vs Arapaho Householder Income Under 25 years Correlation Chart
The statistical analysis conducted on geographies consisting of 338,888,572 people shows a mild positive correlation between the proportion of Salvadorans and household income with householder under the age of 25 in the United States with a correlation coefficient (R) of 0.313 and weighted average of $55,412. Similarly, the statistical analysis conducted on geographies consisting of 28,310,734 people shows a slight negative correlation between the proportion of Arapaho and household income with householder under the age of 25 in the United States with a correlation coefficient (R) of -0.072 and weighted average of $44,003, a difference of 25.9%.
Householder Income Under 25 years Correlation Summary
| Measurement | Salvadoran | Arapaho |
| Minimum | $15,891 | $31,607 |
| Maximum | $126,250 | $58,750 |
| Range | $110,359 | $27,143 |
| Mean | $58,487 | $45,071 |
| Median | $54,772 | $47,132 |
| Interquartile 25% (IQ1) | $49,229 | $36,562 |
| Interquartile 75% (IQ3) | $65,284 | $53,264 |
| Interquartile Range (IQR) | $16,055 | $16,702 |
| Standard Deviation (Sample) | $17,623 | $9,498 |
| Standard Deviation (Population) | $17,535 | $8,955 |
Similar Demographics by Householder Income Under 25 years
Demographics Similar to Salvadorans by Householder Income Under 25 years
In terms of householder income under 25 years, the demographic groups most similar to Salvadorans are Immigrants from Ukraine ($55,447, a difference of 0.060%), Sri Lankan ($55,470, a difference of 0.10%), Immigrants from Poland ($55,474, a difference of 0.11%), Soviet Union ($55,340, a difference of 0.13%), and Immigrants from Romania ($55,522, a difference of 0.20%).
| Demographics | Rating | Rank | Householder Income Under 25 years |
| Iranians | 100.0 /100 | #49 | Exceptional $55,548 |
| Puget Sound Salish | 100.0 /100 | #50 | Exceptional $55,543 |
| Immigrants | Romania | 100.0 /100 | #51 | Exceptional $55,522 |
| Immigrants | Indonesia | 100.0 /100 | #52 | Exceptional $55,521 |
| Immigrants | Poland | 100.0 /100 | #53 | Exceptional $55,474 |
| Sri Lankans | 100.0 /100 | #54 | Exceptional $55,470 |
| Immigrants | Ukraine | 100.0 /100 | #55 | Exceptional $55,447 |
| Salvadorans | 100.0 /100 | #56 | Exceptional $55,412 |
| Soviet Union | 100.0 /100 | #57 | Exceptional $55,340 |
| Guyanese | 99.9 /100 | #58 | Exceptional $55,210 |
| Native Hawaiians | 99.9 /100 | #59 | Exceptional $55,158 |
| Immigrants | Lithuania | 99.9 /100 | #60 | Exceptional $55,028 |
| Immigrants | Europe | 99.9 /100 | #61 | Exceptional $55,022 |
| Immigrants | Uzbekistan | 99.8 /100 | #62 | Exceptional $54,846 |
| Immigrants | Belgium | 99.8 /100 | #63 | Exceptional $54,830 |
Demographics Similar to Arapaho by Householder Income Under 25 years
In terms of householder income under 25 years, the demographic groups most similar to Arapaho are Houma ($44,356, a difference of 0.80%), Black/African American ($44,381, a difference of 0.86%), Immigrants from Yemen ($43,591, a difference of 0.95%), Kiowa ($44,733, a difference of 1.7%), and Immigrants from Congo ($43,266, a difference of 1.7%).
| Demographics | Rating | Rank | Householder Income Under 25 years |
| Creek | 0.0 /100 | #333 | Tragic $45,371 |
| Cajuns | 0.0 /100 | #334 | Tragic $45,338 |
| Cheyenne | 0.0 /100 | #335 | Tragic $45,275 |
| Tohono O'odham | 0.0 /100 | #336 | Tragic $45,248 |
| Pueblo | 0.0 /100 | #337 | Tragic $45,018 |
| Chickasaw | 0.0 /100 | #338 | Tragic $44,763 |
| Kiowa | 0.0 /100 | #339 | Tragic $44,733 |
| Blacks/African Americans | 0.0 /100 | #340 | Tragic $44,381 |
| Houma | 0.0 /100 | #341 | Tragic $44,356 |
| Arapaho | 0.0 /100 | #342 | Tragic $44,003 |
| Immigrants | Yemen | 0.0 /100 | #343 | Tragic $43,591 |
| Immigrants | Congo | 0.0 /100 | #344 | Tragic $43,266 |
| Navajo | 0.0 /100 | #345 | Tragic $42,380 |
| Puerto Ricans | 0.0 /100 | #346 | Tragic $39,726 |
| Lumbee | 0.0 /100 | #347 | Tragic $34,584 |