Immigrants from Southern Europe vs Arapaho Householder Income Under 25 years

COMPARE

Immigrants from Southern Europe
Race
Ancestry
AfghanAfricanAlaska NativeAlaskan AthabascanAlbanianAleutAlsatianAmericanApacheArabArgentineanArmenianAssyrian/Chaldean/SyriacAustralianAustrianBahamianBangladeshiBarbadianBasqueBelgianBelizeanBermudanBhutaneseBlackfeetBolivianBrazilianBritishBritish West IndianBulgarianBurmeseCajunCambodianCanadianCape VerdeanCarpatho RusynCelticCentral AmericanCentral American IndianCherokeeCheyenneChickasawChileanChineseChippewaChoctawColombianColvilleComancheCosta RicanCreeCreekCroatianCrowCubanCypriotCzechCzechoslovakianDanishDelawareDominicanDutchDutch West IndianEastern EuropeanEcuadorianEgyptianEnglishEstonianEthiopianEuropeanFijianFilipinoFinnishFrenchFrench American IndianFrench CanadianGermanGerman RussianGhanaianGreekGuamanian/ChamorroGuatemalanGuyaneseHaitianHmongHonduranHopiHoumaHungarianIcelanderIndian (Asian)IndonesianInupiatIranianIraqiIrishIroquoisIsraeliItalianJamaicanJapaneseJordanianKenyanKiowaKoreanLaotianLatvianLebaneseLiberianLithuanianLumbeeLuxembourgerMacedonianMalaysianMalteseMarshalleseMenomineeMexicanMexican American IndianMongolianMoroccanNative HawaiianNavajoNepaleseNew ZealanderNicaraguanNigerianNorthern EuropeanNorwegianOkinawanOsageOttawaPaiutePakistaniPalestinianPanamanianParaguayanPennsylvania GermanPeruvianPimaPolishPortuguesePotawatomiPuebloPuerto RicanPuget Sound SalishRomanianRussianSalvadoranSamoanScandinavianScotch-IrishScottishSeminoleSenegaleseSerbianShoshoneSierra LeoneanSiouxSlavicSlovakSloveneSomaliSouth AfricanSouth AmericanSouth American IndianSoviet UnionSpaniardSpanishSpanish AmericanSpanish American IndianSri LankanSubsaharan AfricanSudaneseSwedishSwissSyrianTaiwaneseThaiTlingit-HaidaTohono O'OdhamTonganTrinidadian and TobagonianTsimshianTurkishU.S. Virgin IslanderUgandanUkrainianUruguayanUteVenezuelanVietnameseWelshWest IndianYakamaYaquiYugoslavianYumanYup'ikZimbabwean
Immigration
NonimmigrantsImmigrantsAfghanistanAfricaAlbaniaArgentinaArmeniaAsiaAustraliaAustriaBahamasBangladeshBarbadosBelarusBelgiumBelizeBoliviaBosnia and HerzegovinaBrazilBulgariaBurma/MyanmarCabo VerdeCambodiaCameroonCanadaCaribbeanCentral AmericaChileChinaColombiaCongoCosta RicaCroatiaCubaCzechoslovakiaDenmarkDominicaDominican RepublicEastern AfricaEastern AsiaEastern EuropeEcuadorEgyptEl SalvadorEnglandEritreaEthiopiaEuropeFijiFranceGermanyGhanaGreeceGrenadaGuatemalaGuyanaHaitiHondurasHong KongHungaryIndiaIndonesiaIranIraqIrelandIsraelItalyJamaicaJapanJordanKazakhstanKenyaKoreaKuwaitLaosLatin AmericaLatviaLebanonLiberiaLithuaniaMalaysiaMexicoMicronesiaMiddle AfricaMoldovaMoroccoNepalNetherlandsNicaraguaNigeriaNorth AmericaNorth MacedoniaNorthern AfricaNorthern EuropeNorwayOceaniaPakistanPanamaPeruPhilippinesPolandPortugalRomaniaRussiaSaudi ArabiaScotlandSenegalSerbiaSierra LeoneSingaporeSomaliaSouth AfricaSouth AmericaSouth Central AsiaSouth Eastern AsiaSouthern EuropeSpainSri LankaSt. Vincent and the GrenadinesSudanSwedenSwitzerlandSyriaTaiwanThailandTrinidad and TobagoTurkeyUgandaUkraineUruguayUzbekistanVenezuelaVietnamWest IndiesWestern AfricaWestern AsiaWestern EuropeYemenZaireZimbabweAzores
Arapaho
Race
Ancestry
AfghanAfricanAlaska NativeAlaskan AthabascanAlbanianAleutAlsatianAmericanApacheArabArapahoArgentineanArmenianAssyrian/Chaldean/SyriacAustralianAustrianBahamianBangladeshiBarbadianBasqueBelgianBelizeanBermudanBhutaneseBlackfeetBolivianBrazilianBritishBritish West IndianBulgarianBurmeseCajunCambodianCanadianCape VerdeanCarpatho RusynCelticCentral AmericanCentral American IndianCherokeeCheyenneChickasawChileanChineseChippewaChoctawColombianColvilleComancheCosta RicanCreeCreekCroatianCrowCubanCypriotCzechCzechoslovakianDanishDelawareDominicanDutchDutch West IndianEastern EuropeanEcuadorianEgyptianEnglishEstonianEthiopianEuropeanFijianFilipinoFinnishFrenchFrench American IndianFrench CanadianGermanGerman RussianGhanaianGreekGuamanian/ChamorroGuatemalanGuyaneseHaitianHmongHonduranHopiHoumaHungarianIcelanderIndian (Asian)IndonesianInupiatIranianIraqiIrishIroquoisIsraeliItalianJamaicanJapaneseJordanianKenyanKiowaKoreanLaotianLatvianLebaneseLiberianLithuanianLumbeeLuxembourgerMacedonianMalaysianMalteseMarshalleseMenomineeMexicanMexican American IndianMongolianMoroccanNative HawaiianNavajoNepaleseNew ZealanderNicaraguanNigerianNorthern EuropeanNorwegianOkinawanOsageOttawaPaiutePakistaniPalestinianPanamanianParaguayanPennsylvania GermanPeruvianPimaPolishPortuguesePotawatomiPuebloPuerto RicanPuget Sound SalishRomanianRussianSalvadoranSamoanScandinavianScotch-IrishScottishSeminoleSenegaleseSerbianShoshoneSierra LeoneanSiouxSlavicSlovakSloveneSomaliSouth AfricanSouth AmericanSouth American IndianSoviet UnionSpaniardSpanishSpanish AmericanSpanish American IndianSri LankanSubsaharan AfricanSudaneseSwedishSwissSyrianTaiwaneseThaiTlingit-HaidaTohono O'OdhamTonganTrinidadian and TobagonianTsimshianTurkishU.S. Virgin IslanderUgandanUkrainianUruguayanUteVenezuelanVietnameseWelshWest IndianYakamaYaquiYugoslavianYumanYup'ikZimbabwean
Immigration
NonimmigrantsImmigrantsAfghanistanAfricaAlbaniaArgentinaArmeniaAsiaAustraliaAustriaBahamasBangladeshBarbadosBelarusBelgiumBelizeBoliviaBosnia and HerzegovinaBrazilBulgariaBurma/MyanmarCabo VerdeCambodiaCameroonCanadaCaribbeanCentral AmericaChileChinaColombiaCongoCosta RicaCroatiaCubaCzechoslovakiaDenmarkDominicaDominican RepublicEastern AfricaEastern AsiaEastern EuropeEcuadorEgyptEl SalvadorEnglandEritreaEthiopiaEuropeFijiFranceGermanyGhanaGreeceGrenadaGuatemalaGuyanaHaitiHondurasHong KongHungaryIndiaIndonesiaIranIraqIrelandIsraelItalyJamaicaJapanJordanKazakhstanKenyaKoreaKuwaitLaosLatin AmericaLatviaLebanonLiberiaLithuaniaMalaysiaMexicoMicronesiaMiddle AfricaMoldovaMoroccoNepalNetherlandsNicaraguaNigeriaNorth AmericaNorth MacedoniaNorthern AfricaNorthern EuropeNorwayOceaniaPakistanPanamaPeruPhilippinesPolandPortugalRomaniaRussiaSaudi ArabiaScotlandSenegalSerbiaSierra LeoneSingaporeSomaliaSouth AfricaSouth AmericaSouth Central AsiaSouth Eastern AsiaSpainSri LankaSt. Vincent and the GrenadinesSudanSwedenSwitzerlandSyriaTaiwanThailandTrinidad and TobagoTurkeyUgandaUkraineUruguayUzbekistanVenezuelaVietnamWest IndiesWestern AfricaWestern AsiaWestern EuropeYemenZaireZimbabweAzores
Householder Income Under 25 years
Income
Poverty
Unemployment
Labor Participation
Family Structure
Vehicle Availability
Education Level
Disability

Householder Income Under 25 years Comparison

Immigrants from Southern Europe

Arapaho

Exceptional
Tragic
$54,484
HOUSEHOLDER INCOME UNDER 25 YEARS
99.6/ 100
METRIC RATING
77th/ 347
METRIC RANK
$44,003
HOUSEHOLDER INCOME UNDER 25 YEARS
0.0/ 100
METRIC RATING
342nd/ 347
METRIC RANK

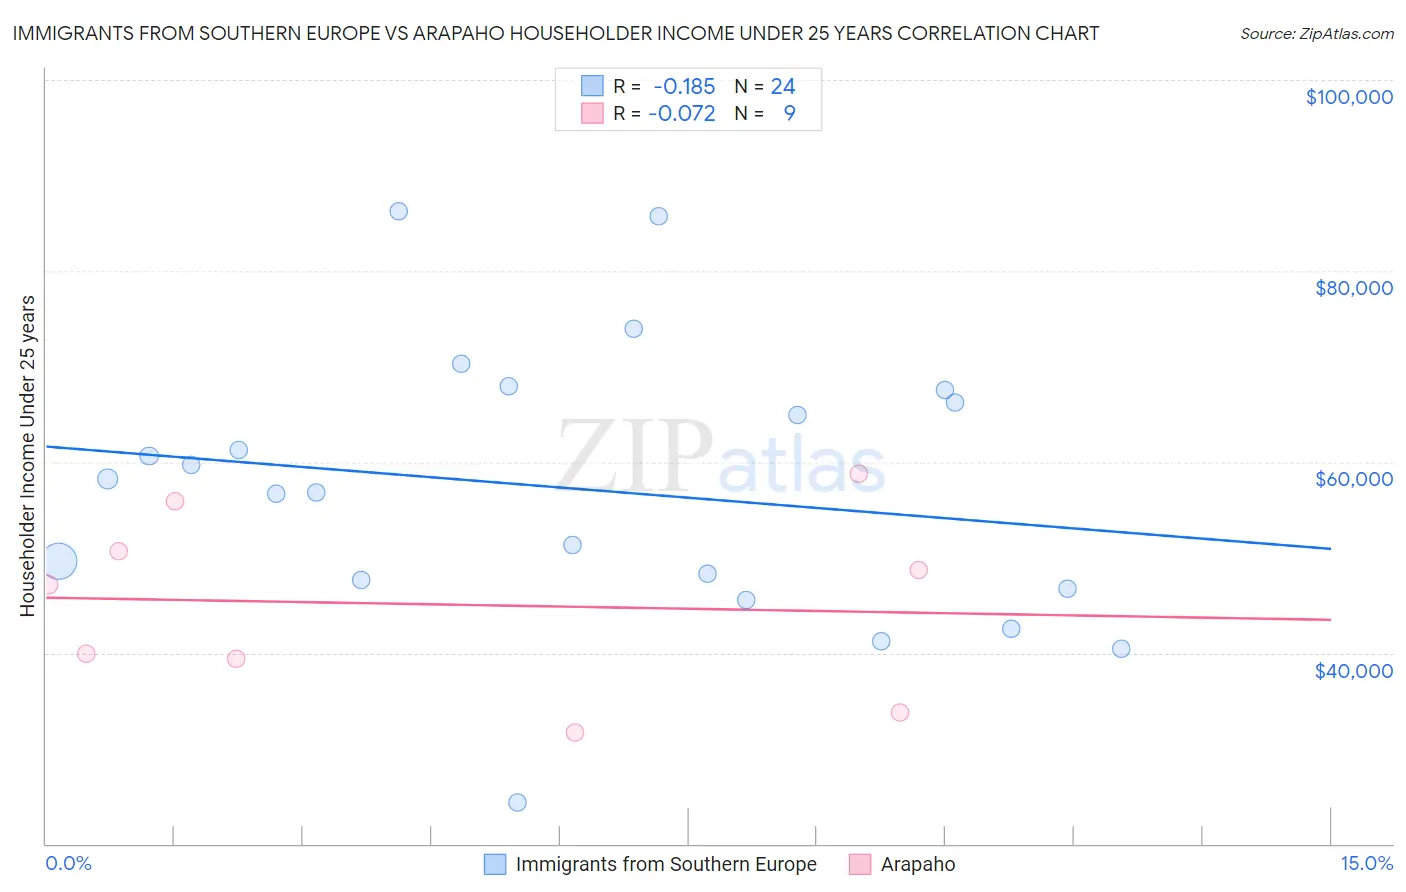
Immigrants from Southern Europe vs Arapaho Householder Income Under 25 years Correlation Chart

The statistical analysis conducted on geographies consisting of 332,779,485 people shows a poor negative correlation between the proportion of Immigrants from Southern Europe and household income with householder under the age of 25 in the United States with a correlation coefficient (R) of -0.185 and weighted average of $54,484. Similarly, the statistical analysis conducted on geographies consisting of 28,310,734 people shows a slight negative correlation between the proportion of Arapaho and household income with householder under the age of 25 in the United States with a correlation coefficient (R) of -0.072 and weighted average of $44,003, a difference of 23.8%.
Immigrants from Southern Europe vs Arapaho Householder Income Under 25 years

Householder Income Under 25 years Correlation Summary

MeasurementImmigrants from Southern EuropeArapaho
Minimum$24,293$31,607
Maximum$86,315$58,750
Range$62,022$27,143
Mean$57,230$45,071
Median$57,501$47,132
Interquartile 25% (IQ1)$47,158$36,562
Interquartile 75% (IQ3)$66,842$53,264
Interquartile Range (IQR)$19,684$16,702
Standard Deviation (Sample)$14,522$9,498
Standard Deviation (Population)$14,216$8,955

Similar Demographics by Householder Income Under 25 years

Demographics Similar to Immigrants from Southern Europe by Householder Income Under 25 years

In terms of householder income under 25 years, the demographic groups most similar to Immigrants from Southern Europe are Immigrants from Brazil ($54,487, a difference of 0.010%), Nepalese ($54,472, a difference of 0.020%), Immigrants from Sri Lanka ($54,512, a difference of 0.050%), Immigrants from Italy ($54,449, a difference of 0.060%), and Egyptian ($54,444, a difference of 0.070%).
DemographicsRating | RankHouseholder Income Under 25 years
Immigrants | El Salvador
99.7
/100
|
#70
Exceptional
$54,599
Immigrants | Morocco
99.7
/100
|
#71
Exceptional
$54,593
Immigrants | Northern Europe
99.7
/100
|
#72
Exceptional
$54,571
Macedonians
99.7
/100
|
#73
Exceptional
$54,563
Immigrants | Grenada
99.7
/100
|
#74
Exceptional
$54,538
Immigrants | Sri Lanka
99.7
/100
|
#75
Exceptional
$54,512
Immigrants | Brazil
99.6
/100
|
#76
Exceptional
$54,487
Immigrants | Southern Europe
99.6
/100
|
#77
Exceptional
$54,484
Nepalese
99.6
/100
|
#78
Exceptional
$54,472
Immigrants | Italy
99.6
/100
|
#79
Exceptional
$54,449
Egyptians
99.6
/100
|
#80
Exceptional
$54,444
Portuguese
99.6
/100
|
#81
Exceptional
$54,436
Russians
99.5
/100
|
#82
Exceptional
$54,389
Laotians
99.5
/100
|
#83
Exceptional
$54,369
Bulgarians
99.5
/100
|
#84
Exceptional
$54,352

Demographics Similar to Arapaho by Householder Income Under 25 years

In terms of householder income under 25 years, the demographic groups most similar to Arapaho are Houma ($44,356, a difference of 0.80%), Black/African American ($44,381, a difference of 0.86%), Immigrants from Yemen ($43,591, a difference of 0.95%), Kiowa ($44,733, a difference of 1.7%), and Immigrants from Congo ($43,266, a difference of 1.7%).
DemographicsRating | RankHouseholder Income Under 25 years
Creek
0.0
/100
|
#333
Tragic
$45,371
Cajuns
0.0
/100
|
#334
Tragic
$45,338
Cheyenne
0.0
/100
|
#335
Tragic
$45,275
Tohono O'odham
0.0
/100
|
#336
Tragic
$45,248
Pueblo
0.0
/100
|
#337
Tragic
$45,018
Chickasaw
0.0
/100
|
#338
Tragic
$44,763
Kiowa
0.0
/100
|
#339
Tragic
$44,733
Blacks/African Americans
0.0
/100
|
#340
Tragic
$44,381
Houma
0.0
/100
|
#341
Tragic
$44,356
Arapaho
0.0
/100
|
#342
Tragic
$44,003
Immigrants | Yemen
0.0
/100
|
#343
Tragic
$43,591
Immigrants | Congo
0.0
/100
|
#344
Tragic
$43,266
Navajo
0.0
/100
|
#345
Tragic
$42,380
Puerto Ricans
0.0
/100
|
#346
Tragic
$39,726
Lumbee
0.0
/100
|
#347
Tragic
$34,584