Luxembourger vs Puerto Rican Householder Income Ages 45 - 64 years
COMPARE
Luxembourger
Puerto Rican
Householder Income Ages 45 - 64 years
Householder Income Ages 45 - 64 years Comparison
Luxembourgers
Puerto Ricans
$103,536
HOUSEHOLDER INCOME AGES 45 - 64 YEARS
83.3/ 100
METRIC RATING
142nd/ 347
METRIC RANK
$69,234
HOUSEHOLDER INCOME AGES 45 - 64 YEARS
0.0/ 100
METRIC RATING
346th/ 347
METRIC RANK
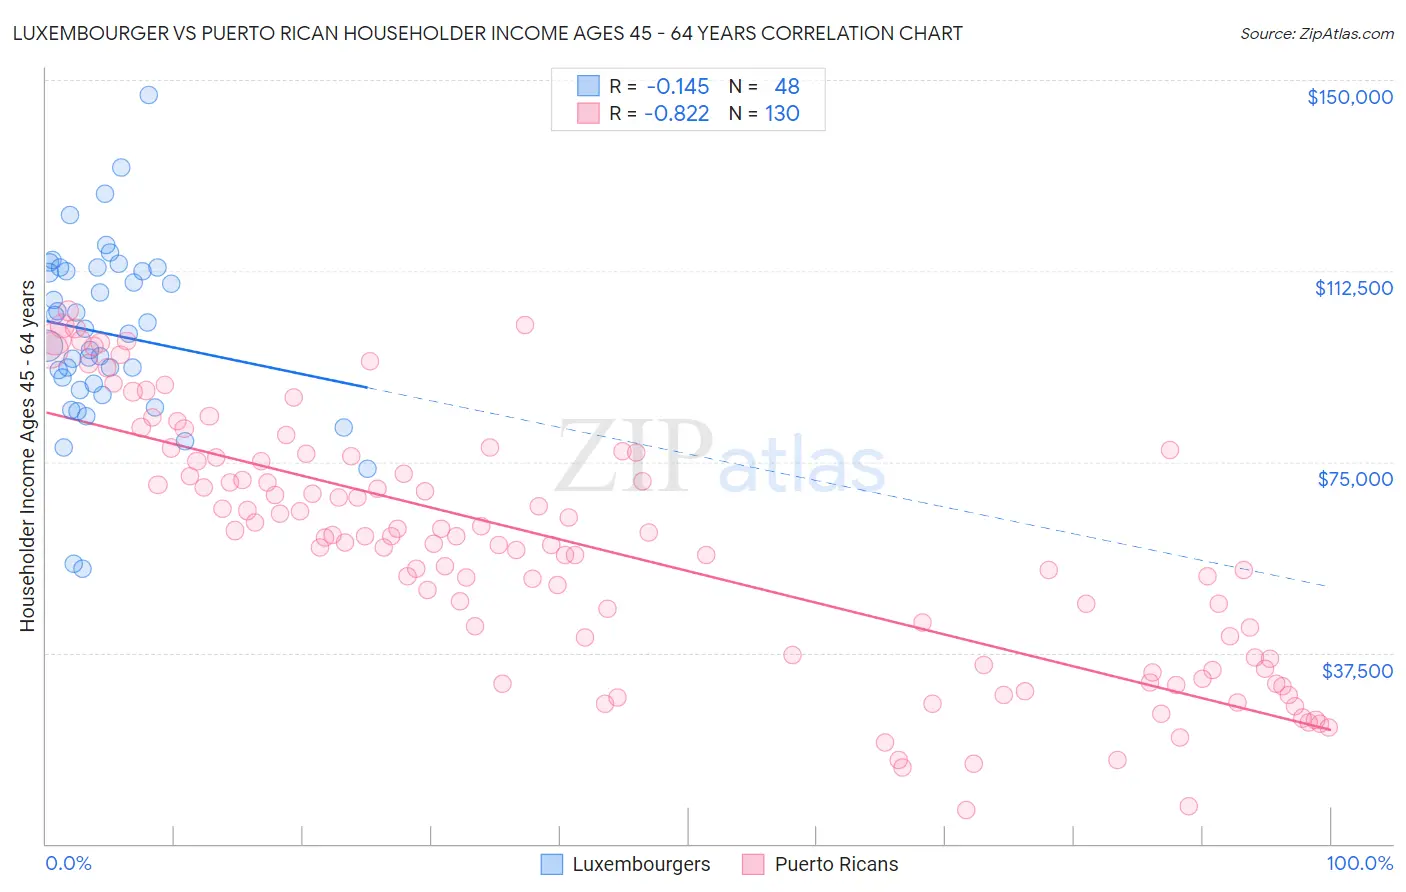
Luxembourger vs Puerto Rican Householder Income Ages 45 - 64 years Correlation Chart
The statistical analysis conducted on geographies consisting of 144,593,524 people shows a poor negative correlation between the proportion of Luxembourgers and household income with householder between the ages 45 and 64 in the United States with a correlation coefficient (R) of -0.145 and weighted average of $103,536. Similarly, the statistical analysis conducted on geographies consisting of 526,175,846 people shows a very strong negative correlation between the proportion of Puerto Ricans and household income with householder between the ages 45 and 64 in the United States with a correlation coefficient (R) of -0.822 and weighted average of $69,234, a difference of 49.5%.
Householder Income Ages 45 - 64 years Correlation Summary
| Measurement | Luxembourger | Puerto Rican |
| Minimum | $54,000 | $6,600 |
| Maximum | $147,008 | $104,645 |
| Range | $93,008 | $98,045 |
| Mean | $100,224 | $58,161 |
| Median | $100,694 | $60,296 |
| Interquartile 25% (IQ1) | $89,750 | $36,266 |
| Interquartile 75% (IQ3) | $112,857 | $75,781 |
| Interquartile Range (IQR) | $23,108 | $39,515 |
| Standard Deviation (Sample) | $17,750 | $24,341 |
| Standard Deviation (Population) | $17,564 | $24,247 |
Similar Demographics by Householder Income Ages 45 - 64 years
Demographics Similar to Luxembourgers by Householder Income Ages 45 - 64 years
In terms of householder income ages 45 - 64 years, the demographic groups most similar to Luxembourgers are Serbian ($103,522, a difference of 0.010%), Czech ($103,507, a difference of 0.030%), Immigrants from Uganda ($103,584, a difference of 0.050%), Ugandan ($103,472, a difference of 0.060%), and Immigrants from Chile ($103,412, a difference of 0.12%).
| Demographics | Rating | Rank | Householder Income Ages 45 - 64 years |
| Brazilians | 88.6 /100 | #135 | Excellent $104,408 |
| Taiwanese | 87.4 /100 | #136 | Excellent $104,180 |
| Hungarians | 85.8 /100 | #137 | Excellent $103,913 |
| Ethiopians | 84.7 /100 | #138 | Excellent $103,736 |
| Immigrants | Oceania | 84.5 /100 | #139 | Excellent $103,705 |
| Norwegians | 84.3 /100 | #140 | Excellent $103,682 |
| Immigrants | Uganda | 83.7 /100 | #141 | Excellent $103,584 |
| Luxembourgers | 83.3 /100 | #142 | Excellent $103,536 |
| Serbians | 83.2 /100 | #143 | Excellent $103,522 |
| Czechs | 83.1 /100 | #144 | Excellent $103,507 |
| Ugandans | 82.9 /100 | #145 | Excellent $103,472 |
| Immigrants | Chile | 82.5 /100 | #146 | Excellent $103,412 |
| Basques | 82.3 /100 | #147 | Excellent $103,387 |
| Immigrants | Germany | 81.5 /100 | #148 | Excellent $103,282 |
| Immigrants | Sierra Leone | 81.1 /100 | #149 | Excellent $103,227 |
Demographics Similar to Puerto Ricans by Householder Income Ages 45 - 64 years
In terms of householder income ages 45 - 64 years, the demographic groups most similar to Puerto Ricans are Navajo ($69,759, a difference of 0.76%), Houma ($72,093, a difference of 4.1%), Pima ($73,365, a difference of 6.0%), Lumbee ($65,113, a difference of 6.3%), and Tohono O'odham ($73,774, a difference of 6.6%).
| Demographics | Rating | Rank | Householder Income Ages 45 - 64 years |
| Immigrants | Congo | 0.0 /100 | #333 | Tragic $77,850 |
| Menominee | 0.0 /100 | #334 | Tragic $76,903 |
| Cheyenne | 0.0 /100 | #335 | Tragic $76,362 |
| Arapaho | 0.0 /100 | #336 | Tragic $75,945 |
| Pueblo | 0.0 /100 | #337 | Tragic $75,601 |
| Hopi | 0.0 /100 | #338 | Tragic $75,562 |
| Kiowa | 0.0 /100 | #339 | Tragic $74,815 |
| Immigrants | Yemen | 0.0 /100 | #340 | Tragic $74,575 |
| Crow | 0.0 /100 | #341 | Tragic $74,257 |
| Tohono O'odham | 0.0 /100 | #342 | Tragic $73,774 |
| Pima | 0.0 /100 | #343 | Tragic $73,365 |
| Houma | 0.0 /100 | #344 | Tragic $72,093 |
| Navajo | 0.0 /100 | #345 | Tragic $69,759 |
| Puerto Ricans | 0.0 /100 | #346 | Tragic $69,234 |
| Lumbee | 0.0 /100 | #347 | Tragic $65,113 |