Asian vs Immigrants from Honduras Median Family Income
COMPARE
Asian
Immigrants from Honduras
Median Family Income
Median Family Income Comparison
Asians
Immigrants from Honduras
$119,955
MEDIAN FAMILY INCOME
100.0/ 100
METRIC RATING
32nd/ 347
METRIC RANK
$83,618
MEDIAN FAMILY INCOME
0.0/ 100
METRIC RATING
319th/ 347
METRIC RANK
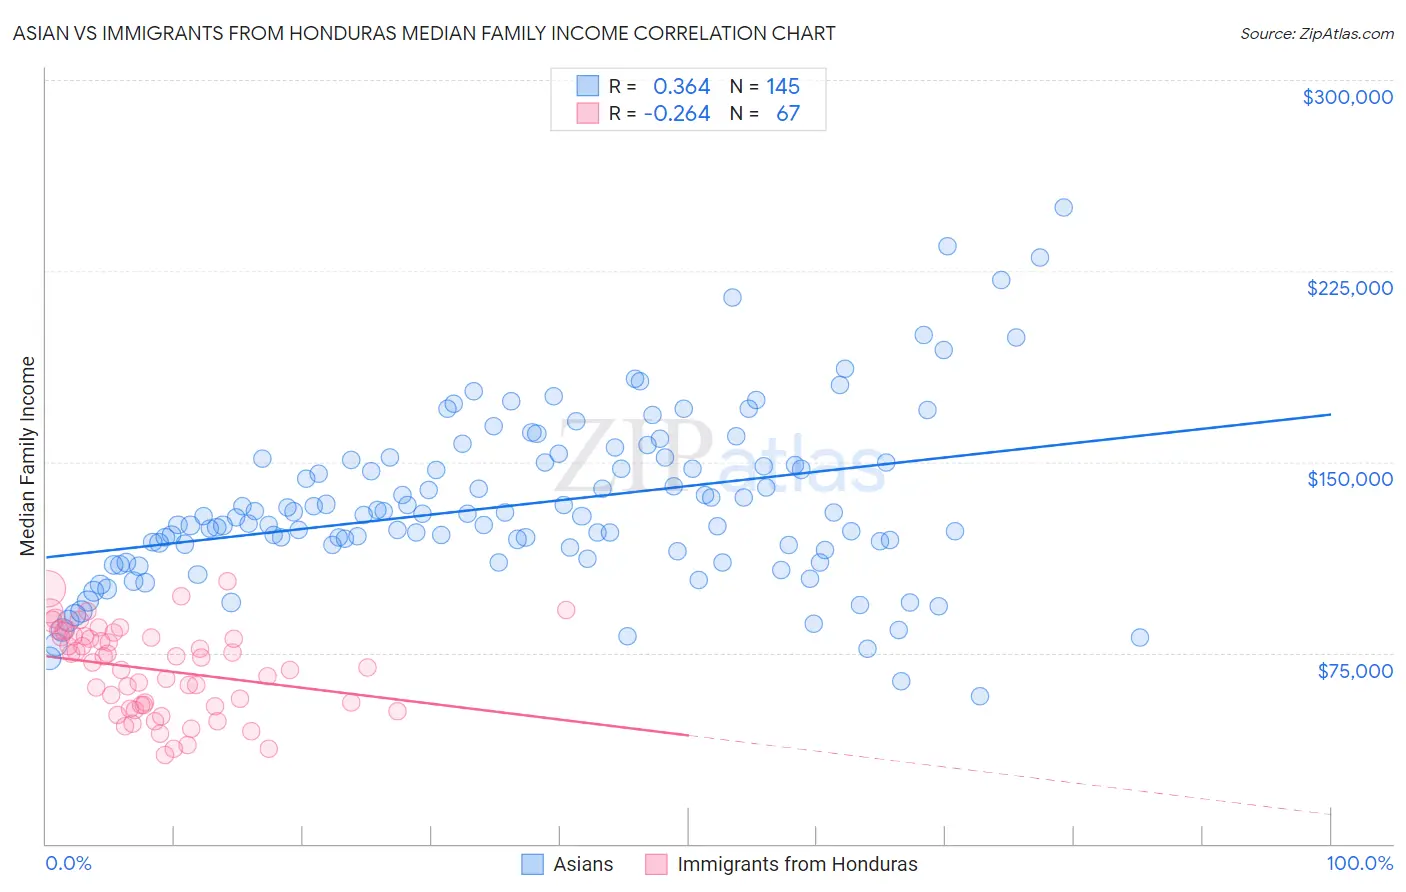
Asian vs Immigrants from Honduras Median Family Income Correlation Chart
The statistical analysis conducted on geographies consisting of 549,758,807 people shows a mild positive correlation between the proportion of Asians and median family income in the United States with a correlation coefficient (R) of 0.364 and weighted average of $119,955. Similarly, the statistical analysis conducted on geographies consisting of 322,401,068 people shows a weak negative correlation between the proportion of Immigrants from Honduras and median family income in the United States with a correlation coefficient (R) of -0.264 and weighted average of $83,618, a difference of 43.5%.
Median Family Income Correlation Summary
| Measurement | Asian | Immigrants from Honduras |
| Minimum | $58,163 | $34,952 |
| Maximum | $250,001 | $103,059 |
| Range | $191,838 | $68,107 |
| Mean | $133,077 | $68,333 |
| Median | $128,500 | $70,983 |
| Interquartile 25% (IQ1) | $115,250 | $53,890 |
| Interquartile 75% (IQ3) | $150,323 | $81,453 |
| Interquartile Range (IQR) | $35,073 | $27,563 |
| Standard Deviation (Sample) | $33,384 | $17,040 |
| Standard Deviation (Population) | $33,269 | $16,912 |
Similar Demographics by Median Family Income
Demographics Similar to Asians by Median Family Income
In terms of median family income, the demographic groups most similar to Asians are Immigrants from France ($120,076, a difference of 0.10%), Bhutanese ($119,800, a difference of 0.13%), Immigrants from Sri Lanka ($120,263, a difference of 0.26%), Latvian ($120,301, a difference of 0.29%), and Bolivian ($119,479, a difference of 0.40%).
| Demographics | Rating | Rank | Median Family Income |
| Turks | 100.0 /100 | #25 | Exceptional $121,202 |
| Immigrants | Switzerland | 100.0 /100 | #26 | Exceptional $120,726 |
| Russians | 100.0 /100 | #27 | Exceptional $120,487 |
| Immigrants | Denmark | 100.0 /100 | #28 | Exceptional $120,445 |
| Latvians | 100.0 /100 | #29 | Exceptional $120,301 |
| Immigrants | Sri Lanka | 100.0 /100 | #30 | Exceptional $120,263 |
| Immigrants | France | 100.0 /100 | #31 | Exceptional $120,076 |
| Asians | 100.0 /100 | #32 | Exceptional $119,955 |
| Bhutanese | 100.0 /100 | #33 | Exceptional $119,800 |
| Bolivians | 100.0 /100 | #34 | Exceptional $119,479 |
| Soviet Union | 100.0 /100 | #35 | Exceptional $119,262 |
| Israelis | 100.0 /100 | #36 | Exceptional $118,577 |
| Australians | 100.0 /100 | #37 | Exceptional $118,440 |
| Immigrants | Turkey | 100.0 /100 | #38 | Exceptional $118,325 |
| Immigrants | Asia | 100.0 /100 | #39 | Exceptional $118,291 |
Demographics Similar to Immigrants from Honduras by Median Family Income
In terms of median family income, the demographic groups most similar to Immigrants from Honduras are Immigrants from Mexico ($83,639, a difference of 0.030%), Seminole ($83,354, a difference of 0.32%), Immigrants from Caribbean ($83,319, a difference of 0.36%), Yakama ($83,932, a difference of 0.38%), and Immigrants from Haiti ($84,018, a difference of 0.48%).
| Demographics | Rating | Rank | Median Family Income |
| Cubans | 0.0 /100 | #312 | Tragic $84,981 |
| Choctaw | 0.0 /100 | #313 | Tragic $84,835 |
| Immigrants | Bahamas | 0.0 /100 | #314 | Tragic $84,732 |
| Apache | 0.0 /100 | #315 | Tragic $84,451 |
| Immigrants | Haiti | 0.0 /100 | #316 | Tragic $84,018 |
| Yakama | 0.0 /100 | #317 | Tragic $83,932 |
| Immigrants | Mexico | 0.0 /100 | #318 | Tragic $83,639 |
| Immigrants | Honduras | 0.0 /100 | #319 | Tragic $83,618 |
| Seminole | 0.0 /100 | #320 | Tragic $83,354 |
| Immigrants | Caribbean | 0.0 /100 | #321 | Tragic $83,319 |
| Dominicans | 0.0 /100 | #322 | Tragic $82,888 |
| Bahamians | 0.0 /100 | #323 | Tragic $82,631 |
| Creek | 0.0 /100 | #324 | Tragic $82,560 |
| Sioux | 0.0 /100 | #325 | Tragic $82,386 |
| Immigrants | Congo | 0.0 /100 | #326 | Tragic $82,216 |