Asian vs Immigrants from Honduras Unemployment Among Ages 30 to 34 years
COMPARE
Asian
Immigrants from Honduras
Unemployment Among Ages 30 to 34 years
Unemployment Among Ages 30 to 34 years Comparison
Asians
Immigrants from Honduras
5.1%
UNEMPLOYMENT AMONG AGES 30 TO 34 YEARS
97.2/ 100
METRIC RATING
58th/ 347
METRIC RANK
6.0%
UNEMPLOYMENT AMONG AGES 30 TO 34 YEARS
0.3/ 100
METRIC RATING
250th/ 347
METRIC RANK
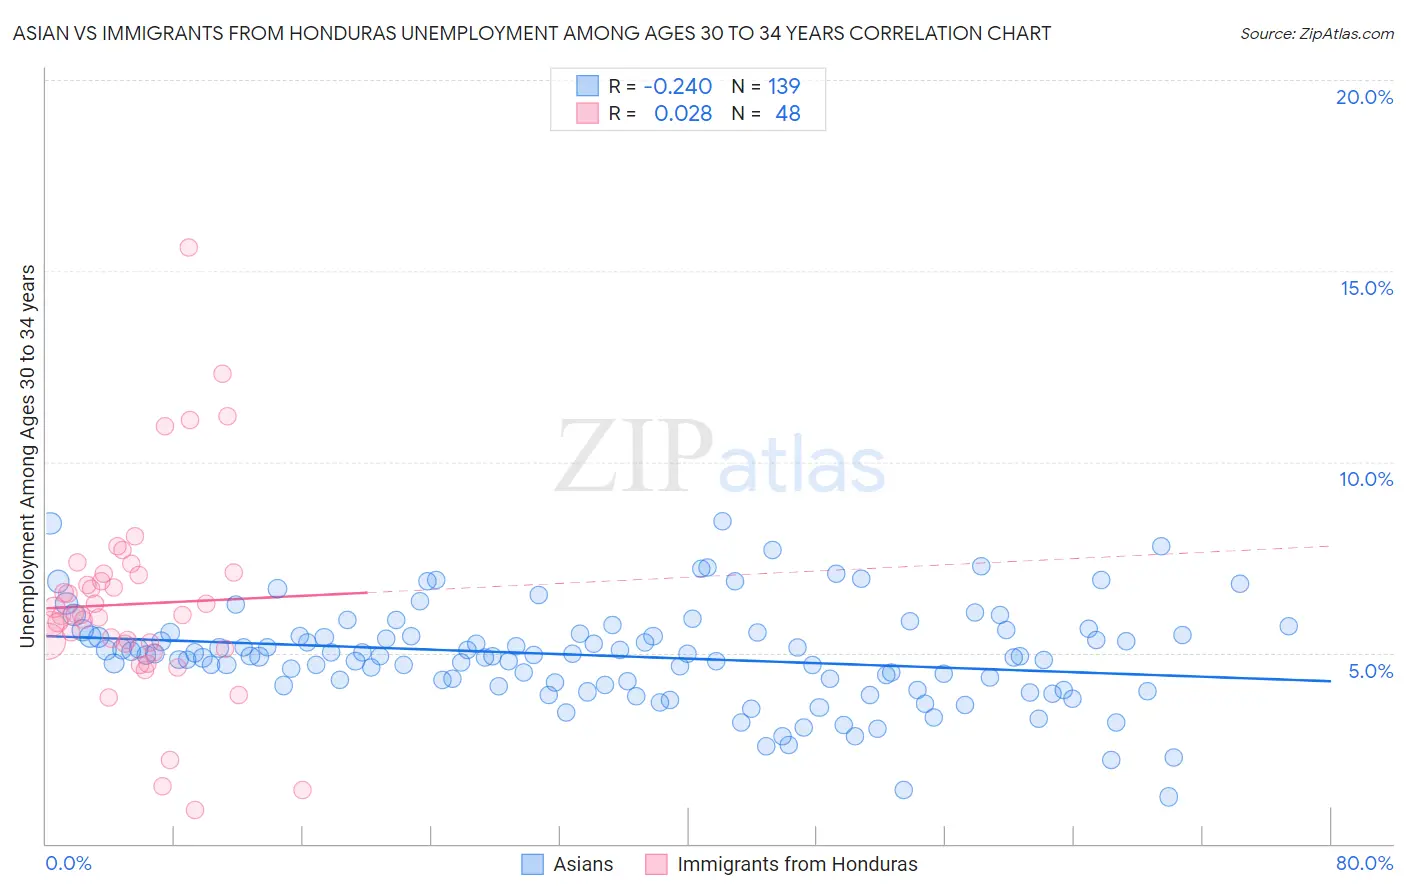
Asian vs Immigrants from Honduras Unemployment Among Ages 30 to 34 years Correlation Chart
The statistical analysis conducted on geographies consisting of 491,020,616 people shows a weak negative correlation between the proportion of Asians and unemployment rate among population between the ages 30 and 34 in the United States with a correlation coefficient (R) of -0.240 and weighted average of 5.1%. Similarly, the statistical analysis conducted on geographies consisting of 310,512,986 people shows no correlation between the proportion of Immigrants from Honduras and unemployment rate among population between the ages 30 and 34 in the United States with a correlation coefficient (R) of 0.028 and weighted average of 6.0%, a difference of 17.5%.
Unemployment Among Ages 30 to 34 years Correlation Summary
| Measurement | Asian | Immigrants from Honduras |
| Minimum | 1.2% | 0.90% |
| Maximum | 8.4% | 15.6% |
| Range | 7.2% | 14.7% |
| Mean | 4.9% | 6.3% |
| Median | 4.9% | 6.0% |
| Interquartile 25% (IQ1) | 4.2% | 5.2% |
| Interquartile 75% (IQ3) | 5.5% | 7.1% |
| Interquartile Range (IQR) | 1.3% | 1.9% |
| Standard Deviation (Sample) | 1.3% | 2.6% |
| Standard Deviation (Population) | 1.3% | 2.6% |
Similar Demographics by Unemployment Among Ages 30 to 34 years
Demographics Similar to Asians by Unemployment Among Ages 30 to 34 years
In terms of unemployment among ages 30 to 34 years, the demographic groups most similar to Asians are Immigrants from China (5.1%, a difference of 0.0%), Swedish (5.1%, a difference of 0.080%), Immigrants from Somalia (5.1%, a difference of 0.090%), Indian (Asian) (5.1%, a difference of 0.12%), and Immigrants from France (5.1%, a difference of 0.14%).
| Demographics | Rating | Rank | Unemployment Among Ages 30 to 34 years |
| Turks | 98.2 /100 | #51 | Exceptional 5.1% |
| Immigrants | Burma/Myanmar | 98.1 /100 | #52 | Exceptional 5.1% |
| Cubans | 98.1 /100 | #53 | Exceptional 5.1% |
| Immigrants | Morocco | 97.9 /100 | #54 | Exceptional 5.1% |
| Chinese | 97.7 /100 | #55 | Exceptional 5.1% |
| Immigrants | Serbia | 97.4 /100 | #56 | Exceptional 5.1% |
| Immigrants | China | 97.2 /100 | #57 | Exceptional 5.1% |
| Asians | 97.2 /100 | #58 | Exceptional 5.1% |
| Swedes | 97.1 /100 | #59 | Exceptional 5.1% |
| Immigrants | Somalia | 97.1 /100 | #60 | Exceptional 5.1% |
| Indians (Asian) | 97.0 /100 | #61 | Exceptional 5.1% |
| Immigrants | France | 97.0 /100 | #62 | Exceptional 5.1% |
| Belgians | 97.0 /100 | #63 | Exceptional 5.1% |
| Immigrants | Eastern Asia | 96.9 /100 | #64 | Exceptional 5.1% |
| Immigrants | Japan | 96.8 /100 | #65 | Exceptional 5.1% |
Demographics Similar to Immigrants from Honduras by Unemployment Among Ages 30 to 34 years
In terms of unemployment among ages 30 to 34 years, the demographic groups most similar to Immigrants from Honduras are Honduran (6.0%, a difference of 0.090%), Nigerian (6.0%, a difference of 0.10%), Immigrants from Guatemala (6.0%, a difference of 0.10%), Ghanaian (6.0%, a difference of 0.16%), and Tlingit-Haida (6.0%, a difference of 0.20%).
| Demographics | Rating | Rank | Unemployment Among Ages 30 to 34 years |
| Immigrants | Liberia | 0.4 /100 | #243 | Tragic 6.0% |
| Immigrants | Micronesia | 0.3 /100 | #244 | Tragic 6.0% |
| Sub-Saharan Africans | 0.3 /100 | #245 | Tragic 6.0% |
| Ghanaians | 0.3 /100 | #246 | Tragic 6.0% |
| Nigerians | 0.3 /100 | #247 | Tragic 6.0% |
| Immigrants | Guatemala | 0.3 /100 | #248 | Tragic 6.0% |
| Hondurans | 0.3 /100 | #249 | Tragic 6.0% |
| Immigrants | Honduras | 0.3 /100 | #250 | Tragic 6.0% |
| Tlingit-Haida | 0.2 /100 | #251 | Tragic 6.0% |
| Potawatomi | 0.2 /100 | #252 | Tragic 6.0% |
| Immigrants | Nonimmigrants | 0.2 /100 | #253 | Tragic 6.1% |
| Armenians | 0.1 /100 | #254 | Tragic 6.1% |
| Immigrants | Portugal | 0.1 /100 | #255 | Tragic 6.1% |
| Immigrants | Ghana | 0.1 /100 | #256 | Tragic 6.1% |
| Immigrants | Sierra Leone | 0.1 /100 | #257 | Tragic 6.1% |