Immigrants from Lithuania vs Immigrants from Honduras Median Family Income
COMPARE
Immigrants from Lithuania
Immigrants from Honduras
Median Family Income
Median Family Income Comparison
Immigrants from Lithuania
Immigrants from Honduras
$118,053
MEDIAN FAMILY INCOME
100.0/ 100
METRIC RATING
40th/ 347
METRIC RANK
$83,618
MEDIAN FAMILY INCOME
0.0/ 100
METRIC RATING
319th/ 347
METRIC RANK
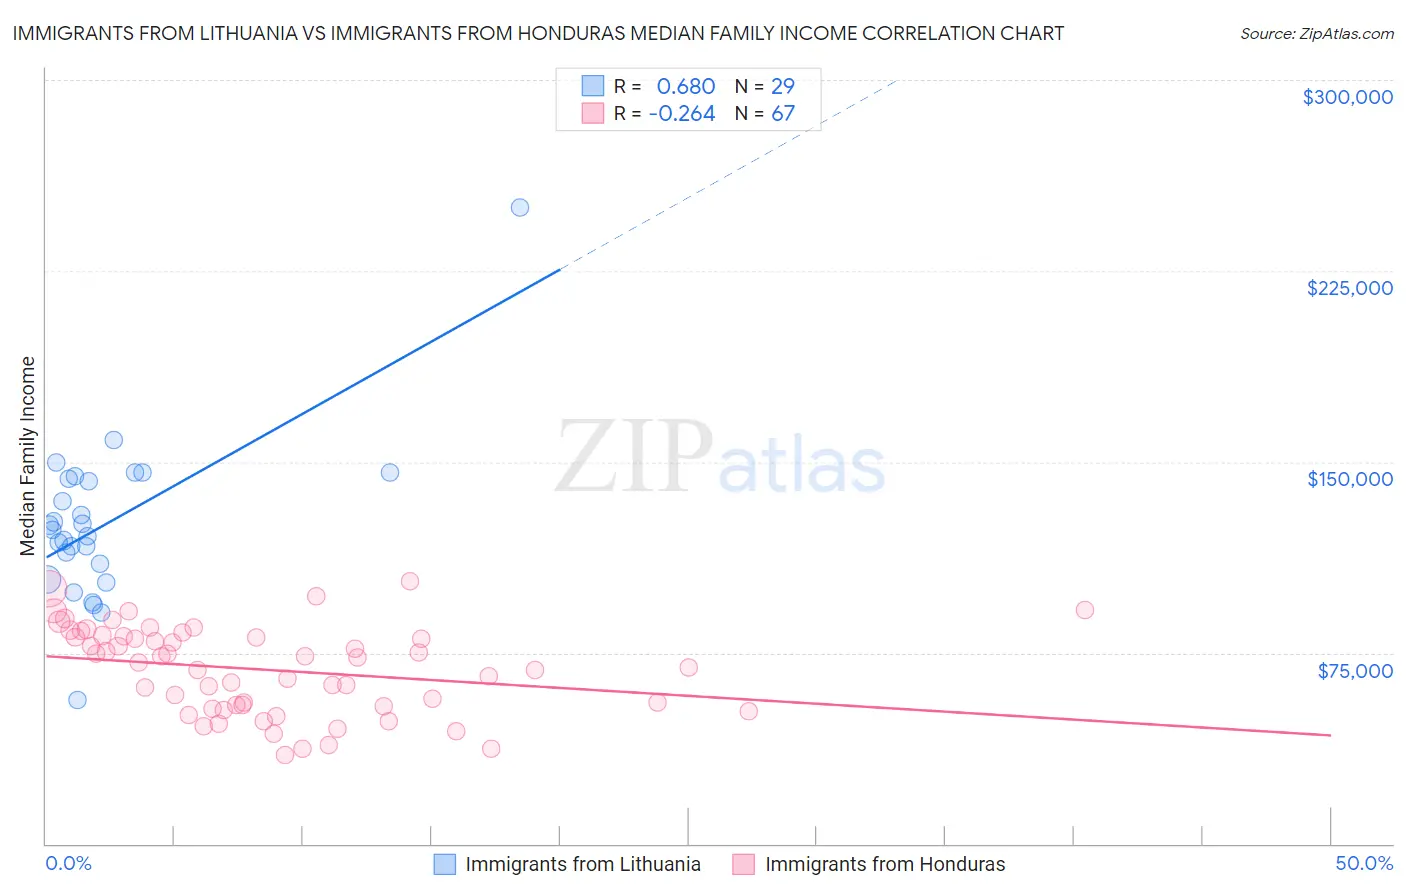
Immigrants from Lithuania vs Immigrants from Honduras Median Family Income Correlation Chart
The statistical analysis conducted on geographies consisting of 117,713,415 people shows a significant positive correlation between the proportion of Immigrants from Lithuania and median family income in the United States with a correlation coefficient (R) of 0.680 and weighted average of $118,053. Similarly, the statistical analysis conducted on geographies consisting of 322,401,068 people shows a weak negative correlation between the proportion of Immigrants from Honduras and median family income in the United States with a correlation coefficient (R) of -0.264 and weighted average of $83,618, a difference of 41.2%.
Median Family Income Correlation Summary
| Measurement | Immigrants from Lithuania | Immigrants from Honduras |
| Minimum | $56,363 | $34,952 |
| Maximum | $250,001 | $103,059 |
| Range | $193,638 | $68,107 |
| Mean | $125,785 | $68,333 |
| Median | $123,201 | $70,983 |
| Interquartile 25% (IQ1) | $106,762 | $53,890 |
| Interquartile 75% (IQ3) | $143,837 | $81,453 |
| Interquartile Range (IQR) | $37,076 | $27,563 |
| Standard Deviation (Sample) | $32,594 | $17,040 |
| Standard Deviation (Population) | $32,027 | $16,912 |
Similar Demographics by Median Family Income
Demographics Similar to Immigrants from Lithuania by Median Family Income
In terms of median family income, the demographic groups most similar to Immigrants from Lithuania are Estonian ($118,013, a difference of 0.030%), Immigrants from Bolivia ($117,912, a difference of 0.12%), Immigrants from Asia ($118,291, a difference of 0.20%), Bulgarian ($117,818, a difference of 0.20%), and Immigrants from Turkey ($118,325, a difference of 0.23%).
| Demographics | Rating | Rank | Median Family Income |
| Bhutanese | 100.0 /100 | #33 | Exceptional $119,800 |
| Bolivians | 100.0 /100 | #34 | Exceptional $119,479 |
| Soviet Union | 100.0 /100 | #35 | Exceptional $119,262 |
| Israelis | 100.0 /100 | #36 | Exceptional $118,577 |
| Australians | 100.0 /100 | #37 | Exceptional $118,440 |
| Immigrants | Turkey | 100.0 /100 | #38 | Exceptional $118,325 |
| Immigrants | Asia | 100.0 /100 | #39 | Exceptional $118,291 |
| Immigrants | Lithuania | 100.0 /100 | #40 | Exceptional $118,053 |
| Estonians | 100.0 /100 | #41 | Exceptional $118,013 |
| Immigrants | Bolivia | 100.0 /100 | #42 | Exceptional $117,912 |
| Bulgarians | 100.0 /100 | #43 | Exceptional $117,818 |
| Cambodians | 100.0 /100 | #44 | Exceptional $117,780 |
| Immigrants | Greece | 99.9 /100 | #45 | Exceptional $117,344 |
| Immigrants | Russia | 99.9 /100 | #46 | Exceptional $116,942 |
| Immigrants | Austria | 99.9 /100 | #47 | Exceptional $116,830 |
Demographics Similar to Immigrants from Honduras by Median Family Income
In terms of median family income, the demographic groups most similar to Immigrants from Honduras are Immigrants from Mexico ($83,639, a difference of 0.030%), Seminole ($83,354, a difference of 0.32%), Immigrants from Caribbean ($83,319, a difference of 0.36%), Yakama ($83,932, a difference of 0.38%), and Immigrants from Haiti ($84,018, a difference of 0.48%).
| Demographics | Rating | Rank | Median Family Income |
| Cubans | 0.0 /100 | #312 | Tragic $84,981 |
| Choctaw | 0.0 /100 | #313 | Tragic $84,835 |
| Immigrants | Bahamas | 0.0 /100 | #314 | Tragic $84,732 |
| Apache | 0.0 /100 | #315 | Tragic $84,451 |
| Immigrants | Haiti | 0.0 /100 | #316 | Tragic $84,018 |
| Yakama | 0.0 /100 | #317 | Tragic $83,932 |
| Immigrants | Mexico | 0.0 /100 | #318 | Tragic $83,639 |
| Immigrants | Honduras | 0.0 /100 | #319 | Tragic $83,618 |
| Seminole | 0.0 /100 | #320 | Tragic $83,354 |
| Immigrants | Caribbean | 0.0 /100 | #321 | Tragic $83,319 |
| Dominicans | 0.0 /100 | #322 | Tragic $82,888 |
| Bahamians | 0.0 /100 | #323 | Tragic $82,631 |
| Creek | 0.0 /100 | #324 | Tragic $82,560 |
| Sioux | 0.0 /100 | #325 | Tragic $82,386 |
| Immigrants | Congo | 0.0 /100 | #326 | Tragic $82,216 |