Armenian vs Immigrants from Grenada Householder Income Over 65 years
COMPARE
Armenian
Immigrants from Grenada
Householder Income Over 65 years
Householder Income Over 65 years Comparison
Armenians
Immigrants from Grenada
$61,656
HOUSEHOLDER INCOME OVER 65 YEARS
67.3/ 100
METRIC RATING
152nd/ 347
METRIC RANK
$50,747
HOUSEHOLDER INCOME OVER 65 YEARS
0.0/ 100
METRIC RATING
330th/ 347
METRIC RANK
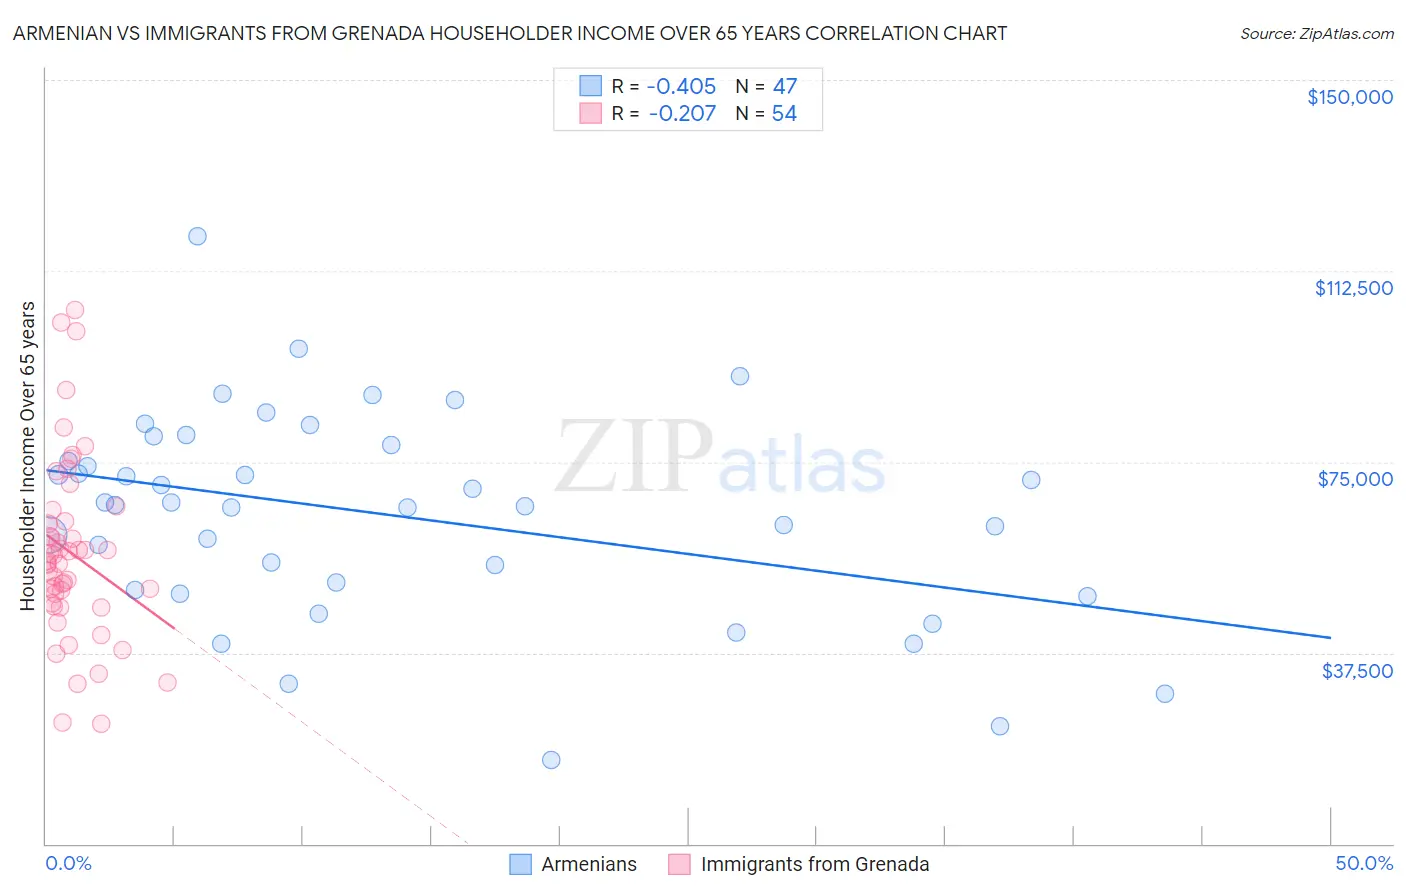
Armenian vs Immigrants from Grenada Householder Income Over 65 years Correlation Chart
The statistical analysis conducted on geographies consisting of 310,212,557 people shows a moderate negative correlation between the proportion of Armenians and household income with householder over the age of 65 in the United States with a correlation coefficient (R) of -0.405 and weighted average of $61,656. Similarly, the statistical analysis conducted on geographies consisting of 67,113,016 people shows a weak negative correlation between the proportion of Immigrants from Grenada and household income with householder over the age of 65 in the United States with a correlation coefficient (R) of -0.207 and weighted average of $50,747, a difference of 21.5%.
Householder Income Over 65 years Correlation Summary
| Measurement | Armenian | Immigrants from Grenada |
| Minimum | $16,529 | $23,659 |
| Maximum | $119,275 | $104,885 |
| Range | $102,746 | $81,226 |
| Mean | $64,521 | $57,145 |
| Median | $66,568 | $55,323 |
| Interquartile 25% (IQ1) | $49,918 | $47,246 |
| Interquartile 75% (IQ3) | $78,241 | $63,328 |
| Interquartile Range (IQR) | $28,323 | $16,082 |
| Standard Deviation (Sample) | $20,266 | $17,613 |
| Standard Deviation (Population) | $20,049 | $17,450 |
Similar Demographics by Householder Income Over 65 years
Demographics Similar to Armenians by Householder Income Over 65 years
In terms of householder income over 65 years, the demographic groups most similar to Armenians are Hungarian ($61,673, a difference of 0.030%), Costa Rican ($61,638, a difference of 0.030%), Swiss ($61,621, a difference of 0.060%), Slavic ($61,709, a difference of 0.090%), and Polish ($61,598, a difference of 0.090%).
| Demographics | Rating | Rank | Householder Income Over 65 years |
| Immigrants | Uganda | 74.2 /100 | #145 | Good $61,976 |
| Immigrants | Southern Europe | 72.7 /100 | #146 | Good $61,902 |
| Immigrants | Nepal | 71.4 /100 | #147 | Good $61,843 |
| Alsatians | 70.5 /100 | #148 | Good $61,797 |
| Scottish | 69.1 /100 | #149 | Good $61,735 |
| Slavs | 68.5 /100 | #150 | Good $61,709 |
| Hungarians | 67.7 /100 | #151 | Good $61,673 |
| Armenians | 67.3 /100 | #152 | Good $61,656 |
| Costa Ricans | 66.9 /100 | #153 | Good $61,638 |
| Swiss | 66.5 /100 | #154 | Good $61,621 |
| Poles | 65.9 /100 | #155 | Good $61,598 |
| Scandinavians | 65.6 /100 | #156 | Good $61,586 |
| Macedonians | 65.1 /100 | #157 | Good $61,564 |
| English | 63.3 /100 | #158 | Good $61,487 |
| Brazilians | 62.7 /100 | #159 | Good $61,465 |
Demographics Similar to Immigrants from Grenada by Householder Income Over 65 years
In terms of householder income over 65 years, the demographic groups most similar to Immigrants from Grenada are Black/African American ($50,779, a difference of 0.060%), Hopi ($50,925, a difference of 0.35%), Pima ($50,539, a difference of 0.41%), Bahamian ($51,000, a difference of 0.50%), and Dutch West Indian ($50,475, a difference of 0.54%).
| Demographics | Rating | Rank | Householder Income Over 65 years |
| Cajuns | 0.0 /100 | #323 | Tragic $51,397 |
| Immigrants | Congo | 0.0 /100 | #324 | Tragic $51,393 |
| Immigrants | Haiti | 0.0 /100 | #325 | Tragic $51,219 |
| Kiowa | 0.0 /100 | #326 | Tragic $51,140 |
| Bahamians | 0.0 /100 | #327 | Tragic $51,000 |
| Hopi | 0.0 /100 | #328 | Tragic $50,925 |
| Blacks/African Americans | 0.0 /100 | #329 | Tragic $50,779 |
| Immigrants | Grenada | 0.0 /100 | #330 | Tragic $50,747 |
| Pima | 0.0 /100 | #331 | Tragic $50,539 |
| Dutch West Indians | 0.0 /100 | #332 | Tragic $50,475 |
| Cape Verdeans | 0.0 /100 | #333 | Tragic $50,077 |
| Immigrants | Dominica | 0.0 /100 | #334 | Tragic $50,071 |
| Crow | 0.0 /100 | #335 | Tragic $49,234 |
| Cubans | 0.0 /100 | #336 | Tragic $49,152 |
| Tohono O'odham | 0.0 /100 | #337 | Tragic $49,121 |