Apache vs Immigrants from Hong Kong Householder Income Under 25 years
COMPARE
Apache
Immigrants from Hong Kong
Householder Income Under 25 years
Householder Income Under 25 years Comparison
Apache
Immigrants from Hong Kong
$49,395
HOUSEHOLDER INCOME UNDER 25 YEARS
0.1/ 100
METRIC RATING
279th/ 347
METRIC RANK
$62,083
HOUSEHOLDER INCOME UNDER 25 YEARS
100.0/ 100
METRIC RATING
2nd/ 347
METRIC RANK
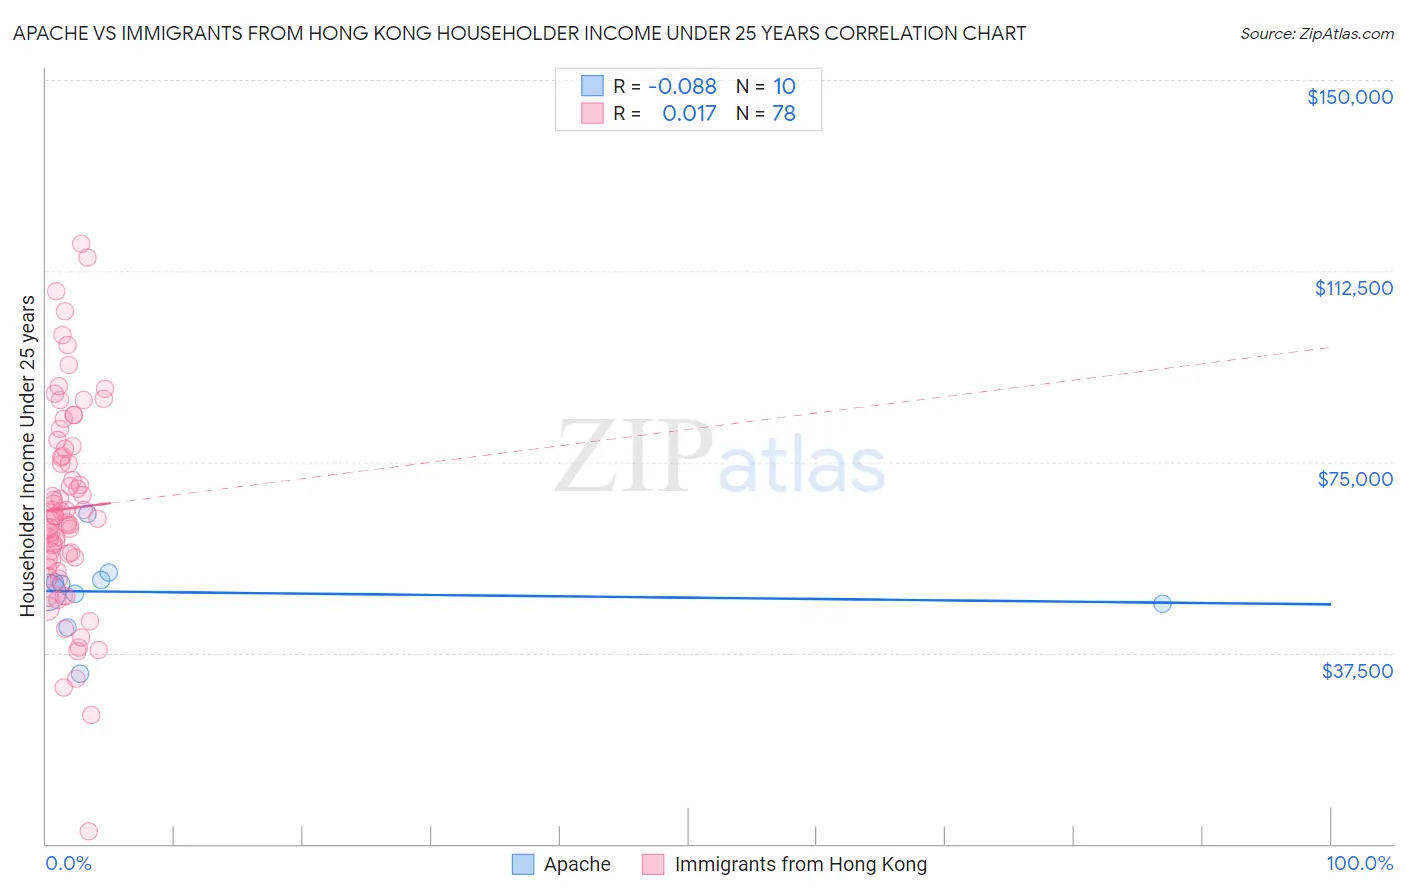
Apache vs Immigrants from Hong Kong Householder Income Under 25 years Correlation Chart
The statistical analysis conducted on geographies consisting of 208,884,010 people shows a slight negative correlation between the proportion of Apache and household income with householder under the age of 25 in the United States with a correlation coefficient (R) of -0.088 and weighted average of $49,395. Similarly, the statistical analysis conducted on geographies consisting of 218,049,197 people shows no correlation between the proportion of Immigrants from Hong Kong and household income with householder under the age of 25 in the United States with a correlation coefficient (R) of 0.017 and weighted average of $62,083, a difference of 25.7%.
Householder Income Under 25 years Correlation Summary
| Measurement | Apache | Immigrants from Hong Kong |
| Minimum | $33,347 | $2,499 |
| Maximum | $64,911 | $117,772 |
| Range | $31,564 | $115,273 |
| Mean | $49,372 | $65,784 |
| Median | $50,154 | $64,057 |
| Interquartile 25% (IQ1) | $47,083 | $55,752 |
| Interquartile 75% (IQ3) | $51,895 | $77,500 |
| Interquartile Range (IQR) | $4,812 | $21,748 |
| Standard Deviation (Sample) | $8,028 | $20,300 |
| Standard Deviation (Population) | $7,616 | $20,169 |
Similar Demographics by Householder Income Under 25 years
Demographics Similar to Apache by Householder Income Under 25 years
In terms of householder income under 25 years, the demographic groups most similar to Apache are Nigerian ($49,416, a difference of 0.040%), Hmong ($49,364, a difference of 0.060%), Nonimmigrants ($49,348, a difference of 0.090%), Alsatian ($49,267, a difference of 0.26%), and Immigrants from Nigeria ($49,174, a difference of 0.45%).
| Demographics | Rating | Rank | Householder Income Under 25 years |
| Colville | 0.3 /100 | #272 | Tragic $49,774 |
| Slovaks | 0.3 /100 | #273 | Tragic $49,753 |
| Immigrants | Senegal | 0.3 /100 | #274 | Tragic $49,742 |
| Immigrants | Kenya | 0.2 /100 | #275 | Tragic $49,633 |
| Dominicans | 0.2 /100 | #276 | Tragic $49,633 |
| Immigrants | Western Africa | 0.2 /100 | #277 | Tragic $49,621 |
| Nigerians | 0.1 /100 | #278 | Tragic $49,416 |
| Apache | 0.1 /100 | #279 | Tragic $49,395 |
| Hmong | 0.1 /100 | #280 | Tragic $49,364 |
| Immigrants | Nonimmigrants | 0.1 /100 | #281 | Tragic $49,348 |
| Alsatians | 0.1 /100 | #282 | Tragic $49,267 |
| Immigrants | Nigeria | 0.1 /100 | #283 | Tragic $49,174 |
| Carpatho Rusyns | 0.1 /100 | #284 | Tragic $49,113 |
| Scotch-Irish | 0.0 /100 | #285 | Tragic $49,039 |
| French American Indians | 0.0 /100 | #286 | Tragic $48,977 |
Demographics Similar to Immigrants from Hong Kong by Householder Income Under 25 years
In terms of householder income under 25 years, the demographic groups most similar to Immigrants from Hong Kong are Immigrants from India ($59,914, a difference of 3.6%), Immigrants from Taiwan ($59,424, a difference of 4.5%), Immigrants from Bolivia ($59,389, a difference of 4.5%), Thai ($59,187, a difference of 4.9%), and Assyrian/Chaldean/Syriac ($65,329, a difference of 5.2%).
| Demographics | Rating | Rank | Householder Income Under 25 years |
| Assyrians/Chaldeans/Syriacs | 100.0 /100 | #1 | Exceptional $65,329 |
| Immigrants | Hong Kong | 100.0 /100 | #2 | Exceptional $62,083 |
| Immigrants | India | 100.0 /100 | #3 | Exceptional $59,914 |
| Immigrants | Taiwan | 100.0 /100 | #4 | Exceptional $59,424 |
| Immigrants | Bolivia | 100.0 /100 | #5 | Exceptional $59,389 |
| Thais | 100.0 /100 | #6 | Exceptional $59,187 |
| Bolivians | 100.0 /100 | #7 | Exceptional $58,506 |
| Indians (Asian) | 100.0 /100 | #8 | Exceptional $58,239 |
| Chinese | 100.0 /100 | #9 | Exceptional $58,162 |
| Afghans | 100.0 /100 | #10 | Exceptional $58,019 |
| Immigrants | China | 100.0 /100 | #11 | Exceptional $57,931 |
| Immigrants | Philippines | 100.0 /100 | #12 | Exceptional $57,930 |
| Immigrants | South Central Asia | 100.0 /100 | #13 | Exceptional $57,818 |
| Filipinos | 100.0 /100 | #14 | Exceptional $57,740 |
| Koreans | 100.0 /100 | #15 | Exceptional $57,730 |