Apache vs Immigrants from Bulgaria Householder Income Under 25 years
COMPARE
Apache
Immigrants from Bulgaria
Householder Income Under 25 years
Householder Income Under 25 years Comparison
Apache
Immigrants from Bulgaria
$49,395
HOUSEHOLDER INCOME UNDER 25 YEARS
0.1/ 100
METRIC RATING
279th/ 347
METRIC RANK
$53,305
HOUSEHOLDER INCOME UNDER 25 YEARS
93.9/ 100
METRIC RATING
128th/ 347
METRIC RANK
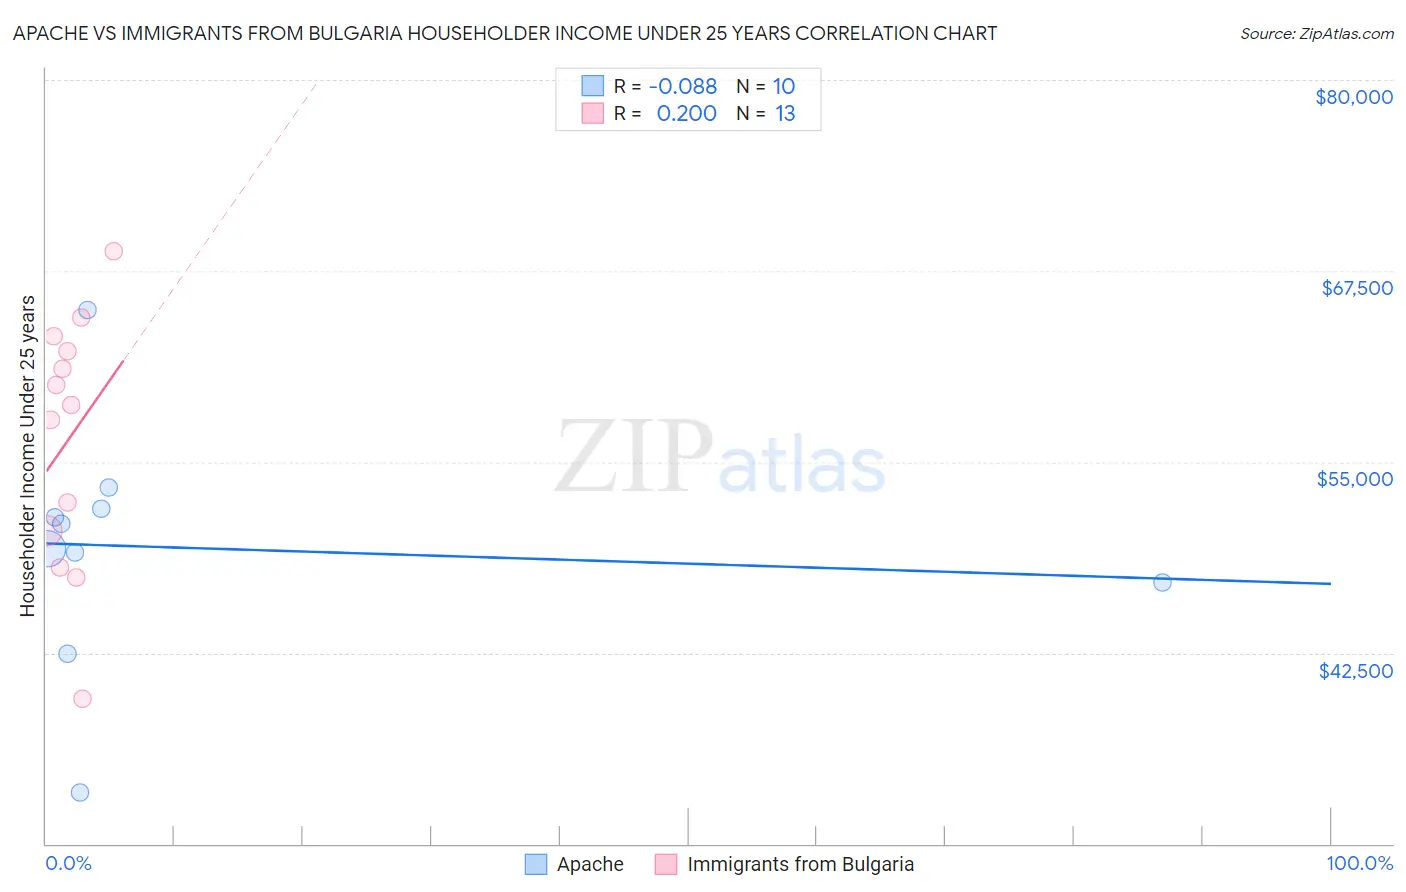
Apache vs Immigrants from Bulgaria Householder Income Under 25 years Correlation Chart
The statistical analysis conducted on geographies consisting of 208,884,010 people shows a slight negative correlation between the proportion of Apache and household income with householder under the age of 25 in the United States with a correlation coefficient (R) of -0.088 and weighted average of $49,395. Similarly, the statistical analysis conducted on geographies consisting of 155,914,228 people shows a weak positive correlation between the proportion of Immigrants from Bulgaria and household income with householder under the age of 25 in the United States with a correlation coefficient (R) of 0.200 and weighted average of $53,305, a difference of 7.9%.
Householder Income Under 25 years Correlation Summary
| Measurement | Apache | Immigrants from Bulgaria |
| Minimum | $33,347 | $39,500 |
| Maximum | $64,911 | $68,750 |
| Range | $31,564 | $29,250 |
| Mean | $49,372 | $56,467 |
| Median | $50,154 | $58,750 |
| Interquartile 25% (IQ1) | $47,083 | $49,292 |
| Interquartile 75% (IQ3) | $51,895 | $62,732 |
| Interquartile Range (IQR) | $4,812 | $13,440 |
| Standard Deviation (Sample) | $8,028 | $8,296 |
| Standard Deviation (Population) | $7,616 | $7,971 |
Similar Demographics by Householder Income Under 25 years
Demographics Similar to Apache by Householder Income Under 25 years
In terms of householder income under 25 years, the demographic groups most similar to Apache are Nigerian ($49,416, a difference of 0.040%), Hmong ($49,364, a difference of 0.060%), Nonimmigrants ($49,348, a difference of 0.090%), Alsatian ($49,267, a difference of 0.26%), and Immigrants from Nigeria ($49,174, a difference of 0.45%).
| Demographics | Rating | Rank | Householder Income Under 25 years |
| Colville | 0.3 /100 | #272 | Tragic $49,774 |
| Slovaks | 0.3 /100 | #273 | Tragic $49,753 |
| Immigrants | Senegal | 0.3 /100 | #274 | Tragic $49,742 |
| Immigrants | Kenya | 0.2 /100 | #275 | Tragic $49,633 |
| Dominicans | 0.2 /100 | #276 | Tragic $49,633 |
| Immigrants | Western Africa | 0.2 /100 | #277 | Tragic $49,621 |
| Nigerians | 0.1 /100 | #278 | Tragic $49,416 |
| Apache | 0.1 /100 | #279 | Tragic $49,395 |
| Hmong | 0.1 /100 | #280 | Tragic $49,364 |
| Immigrants | Nonimmigrants | 0.1 /100 | #281 | Tragic $49,348 |
| Alsatians | 0.1 /100 | #282 | Tragic $49,267 |
| Immigrants | Nigeria | 0.1 /100 | #283 | Tragic $49,174 |
| Carpatho Rusyns | 0.1 /100 | #284 | Tragic $49,113 |
| Scotch-Irish | 0.0 /100 | #285 | Tragic $49,039 |
| French American Indians | 0.0 /100 | #286 | Tragic $48,977 |
Demographics Similar to Immigrants from Bulgaria by Householder Income Under 25 years
In terms of householder income under 25 years, the demographic groups most similar to Immigrants from Bulgaria are Immigrants from North America ($53,307, a difference of 0.0%), New Zealander ($53,294, a difference of 0.020%), Immigrants from Serbia ($53,321, a difference of 0.030%), Pakistani ($53,325, a difference of 0.040%), and Nicaraguan ($53,275, a difference of 0.060%).
| Demographics | Rating | Rank | Householder Income Under 25 years |
| Immigrants | Canada | 95.2 /100 | #121 | Exceptional $53,411 |
| Immigrants | Ethiopia | 95.2 /100 | #122 | Exceptional $53,408 |
| Immigrants | Iraq | 94.9 /100 | #123 | Exceptional $53,384 |
| Colombians | 94.6 /100 | #124 | Exceptional $53,357 |
| Pakistanis | 94.1 /100 | #125 | Exceptional $53,325 |
| Immigrants | Serbia | 94.1 /100 | #126 | Exceptional $53,321 |
| Immigrants | North America | 93.9 /100 | #127 | Exceptional $53,307 |
| Immigrants | Bulgaria | 93.9 /100 | #128 | Exceptional $53,305 |
| New Zealanders | 93.7 /100 | #129 | Exceptional $53,294 |
| Nicaraguans | 93.4 /100 | #130 | Exceptional $53,275 |
| Immigrants | Nicaragua | 93.3 /100 | #131 | Exceptional $53,266 |
| Moroccans | 93.1 /100 | #132 | Exceptional $53,256 |
| Immigrants | Immigrants | 92.2 /100 | #133 | Exceptional $53,201 |
| Immigrants | Northern Africa | 91.9 /100 | #134 | Exceptional $53,185 |
| Chileans | 91.9 /100 | #135 | Exceptional $53,185 |