Apache vs Immigrants from Hong Kong Householder Income Ages 45 - 64 years
COMPARE
Apache
Immigrants from Hong Kong
Householder Income Ages 45 - 64 years
Householder Income Ages 45 - 64 years Comparison
Apache
Immigrants from Hong Kong
$82,184
HOUSEHOLDER INCOME AGES 45 - 64 YEARS
0.0/ 100
METRIC RATING
320th/ 347
METRIC RANK
$127,500
HOUSEHOLDER INCOME AGES 45 - 64 YEARS
100.0/ 100
METRIC RATING
7th/ 347
METRIC RANK
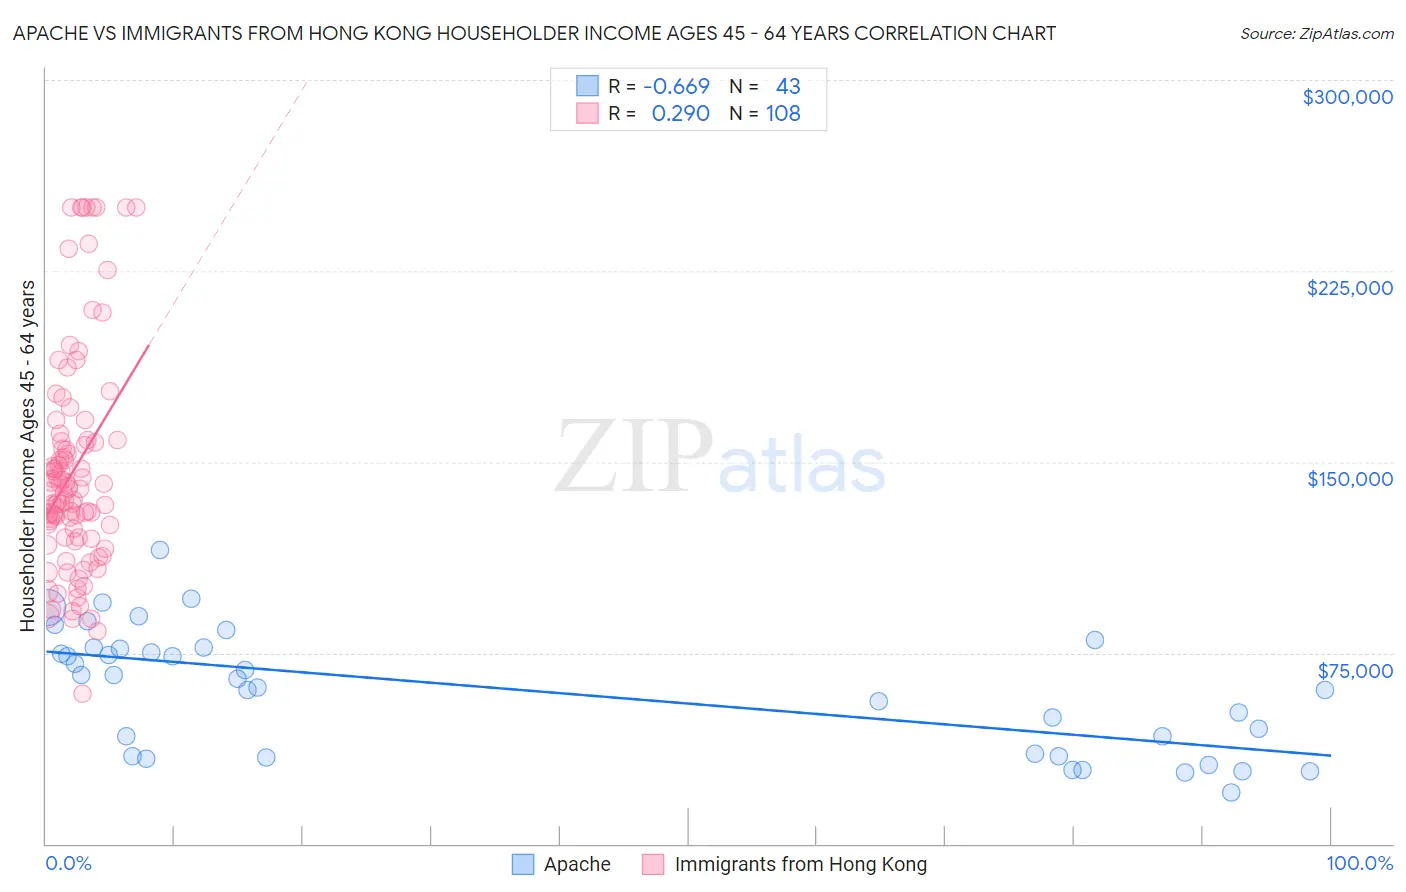
Apache vs Immigrants from Hong Kong Householder Income Ages 45 - 64 years Correlation Chart
The statistical analysis conducted on geographies consisting of 230,746,916 people shows a significant negative correlation between the proportion of Apache and household income with householder between the ages 45 and 64 in the United States with a correlation coefficient (R) of -0.669 and weighted average of $82,184. Similarly, the statistical analysis conducted on geographies consisting of 253,785,211 people shows a weak positive correlation between the proportion of Immigrants from Hong Kong and household income with householder between the ages 45 and 64 in the United States with a correlation coefficient (R) of 0.290 and weighted average of $127,500, a difference of 55.1%.
Householder Income Ages 45 - 64 years Correlation Summary
| Measurement | Apache | Immigrants from Hong Kong |
| Minimum | $19,917 | $59,041 |
| Maximum | $115,357 | $250,001 |
| Range | $95,440 | $190,960 |
| Mean | $60,429 | $146,614 |
| Median | $64,821 | $138,796 |
| Interquartile 25% (IQ1) | $34,492 | $120,380 |
| Interquartile 75% (IQ3) | $77,043 | $158,248 |
| Interquartile Range (IQR) | $42,551 | $37,867 |
| Standard Deviation (Sample) | $23,821 | $42,909 |
| Standard Deviation (Population) | $23,542 | $42,710 |
Similar Demographics by Householder Income Ages 45 - 64 years
Demographics Similar to Apache by Householder Income Ages 45 - 64 years
In terms of householder income ages 45 - 64 years, the demographic groups most similar to Apache are Chickasaw ($82,193, a difference of 0.010%), Yuman ($82,139, a difference of 0.050%), Choctaw ($82,287, a difference of 0.13%), Colville ($82,474, a difference of 0.35%), and Immigrants from Caribbean ($82,513, a difference of 0.40%).
| Demographics | Rating | Rank | Householder Income Ages 45 - 64 years |
| U.S. Virgin Islanders | 0.0 /100 | #313 | Tragic $82,736 |
| Immigrants | Honduras | 0.0 /100 | #314 | Tragic $82,697 |
| Paiute | 0.0 /100 | #315 | Tragic $82,629 |
| Immigrants | Caribbean | 0.0 /100 | #316 | Tragic $82,513 |
| Colville | 0.0 /100 | #317 | Tragic $82,474 |
| Choctaw | 0.0 /100 | #318 | Tragic $82,287 |
| Chickasaw | 0.0 /100 | #319 | Tragic $82,193 |
| Apache | 0.0 /100 | #320 | Tragic $82,184 |
| Yuman | 0.0 /100 | #321 | Tragic $82,139 |
| Sioux | 0.0 /100 | #322 | Tragic $81,750 |
| Bahamians | 0.0 /100 | #323 | Tragic $81,369 |
| Yup'ik | 0.0 /100 | #324 | Tragic $81,000 |
| Immigrants | Cuba | 0.0 /100 | #325 | Tragic $80,662 |
| Dominicans | 0.0 /100 | #326 | Tragic $80,623 |
| Seminole | 0.0 /100 | #327 | Tragic $80,077 |
Demographics Similar to Immigrants from Hong Kong by Householder Income Ages 45 - 64 years
In terms of householder income ages 45 - 64 years, the demographic groups most similar to Immigrants from Hong Kong are Immigrants from Iran ($126,940, a difference of 0.44%), Iranian ($129,350, a difference of 1.5%), Immigrants from Singapore ($129,514, a difference of 1.6%), Thai ($129,560, a difference of 1.6%), and Okinawan ($124,796, a difference of 2.2%).
| Demographics | Rating | Rank | Householder Income Ages 45 - 64 years |
| Immigrants | Taiwan | 100.0 /100 | #1 | Exceptional $135,508 |
| Filipinos | 100.0 /100 | #2 | Exceptional $134,910 |
| Immigrants | India | 100.0 /100 | #3 | Exceptional $132,488 |
| Thais | 100.0 /100 | #4 | Exceptional $129,560 |
| Immigrants | Singapore | 100.0 /100 | #5 | Exceptional $129,514 |
| Iranians | 100.0 /100 | #6 | Exceptional $129,350 |
| Immigrants | Hong Kong | 100.0 /100 | #7 | Exceptional $127,500 |
| Immigrants | Iran | 100.0 /100 | #8 | Exceptional $126,940 |
| Okinawans | 100.0 /100 | #9 | Exceptional $124,796 |
| Immigrants | South Central Asia | 100.0 /100 | #10 | Exceptional $124,188 |
| Cypriots | 100.0 /100 | #11 | Exceptional $123,396 |
| Immigrants | Israel | 100.0 /100 | #12 | Exceptional $122,893 |
| Immigrants | Ireland | 100.0 /100 | #13 | Exceptional $122,757 |
| Indians (Asian) | 100.0 /100 | #14 | Exceptional $122,343 |
| Immigrants | Eastern Asia | 100.0 /100 | #15 | Exceptional $122,222 |