African vs Immigrants from Ireland Householder Income Ages 45 - 64 years
COMPARE
African
Immigrants from Ireland
Householder Income Ages 45 - 64 years
Householder Income Ages 45 - 64 years Comparison
Africans
Immigrants from Ireland
$84,925
HOUSEHOLDER INCOME AGES 45 - 64 YEARS
0.0/ 100
METRIC RATING
298th/ 347
METRIC RANK
$122,757
HOUSEHOLDER INCOME AGES 45 - 64 YEARS
100.0/ 100
METRIC RATING
13th/ 347
METRIC RANK
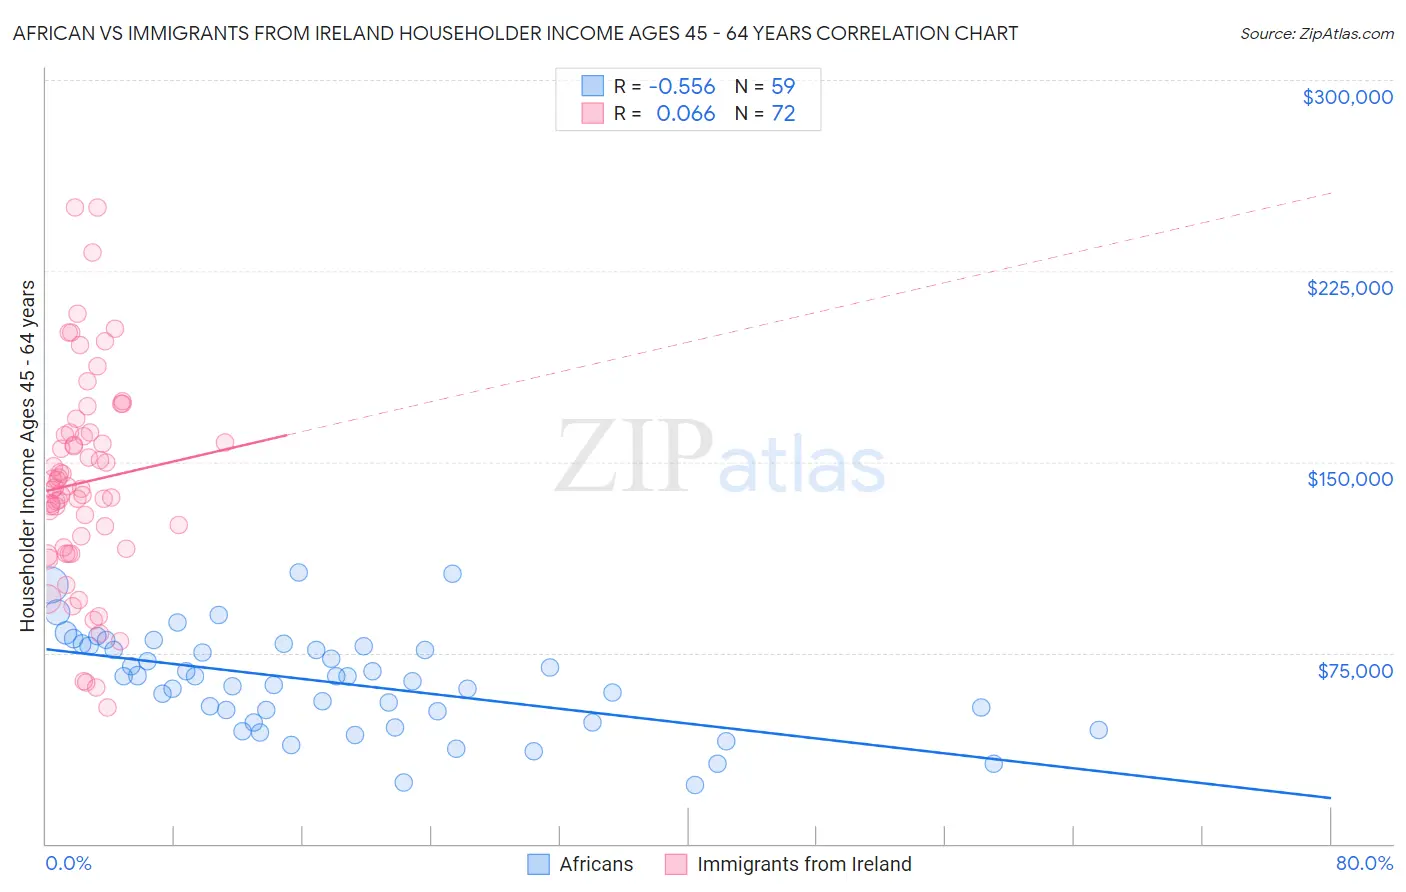
African vs Immigrants from Ireland Householder Income Ages 45 - 64 years Correlation Chart
The statistical analysis conducted on geographies consisting of 468,468,488 people shows a substantial negative correlation between the proportion of Africans and household income with householder between the ages 45 and 64 in the United States with a correlation coefficient (R) of -0.556 and weighted average of $84,925. Similarly, the statistical analysis conducted on geographies consisting of 240,617,521 people shows a slight positive correlation between the proportion of Immigrants from Ireland and household income with householder between the ages 45 and 64 in the United States with a correlation coefficient (R) of 0.066 and weighted average of $122,757, a difference of 44.6%.
Householder Income Ages 45 - 64 years Correlation Summary
| Measurement | African | Immigrants from Ireland |
| Minimum | $23,133 | $53,750 |
| Maximum | $106,630 | $250,001 |
| Range | $83,497 | $196,251 |
| Mean | $63,321 | $141,948 |
| Median | $65,668 | $139,768 |
| Interquartile 25% (IQ1) | $47,695 | $116,086 |
| Interquartile 75% (IQ3) | $77,568 | $161,016 |
| Interquartile Range (IQR) | $29,873 | $44,930 |
| Standard Deviation (Sample) | $19,169 | $40,881 |
| Standard Deviation (Population) | $19,006 | $40,596 |
Similar Demographics by Householder Income Ages 45 - 64 years
Demographics Similar to Africans by Householder Income Ages 45 - 64 years
In terms of householder income ages 45 - 64 years, the demographic groups most similar to Africans are Immigrants from Mexico ($84,910, a difference of 0.020%), Indonesian ($84,890, a difference of 0.040%), Fijian ($85,187, a difference of 0.31%), Immigrants from Zaire ($85,207, a difference of 0.33%), and Potawatomi ($84,613, a difference of 0.37%).
| Demographics | Rating | Rank | Householder Income Ages 45 - 64 years |
| Hispanics or Latinos | 0.1 /100 | #291 | Tragic $86,006 |
| Immigrants | Central America | 0.1 /100 | #292 | Tragic $85,965 |
| Comanche | 0.1 /100 | #293 | Tragic $85,787 |
| British West Indians | 0.1 /100 | #294 | Tragic $85,571 |
| Immigrants | Grenada | 0.1 /100 | #295 | Tragic $85,552 |
| Immigrants | Zaire | 0.1 /100 | #296 | Tragic $85,207 |
| Fijians | 0.1 /100 | #297 | Tragic $85,187 |
| Africans | 0.0 /100 | #298 | Tragic $84,925 |
| Immigrants | Mexico | 0.0 /100 | #299 | Tragic $84,910 |
| Indonesians | 0.0 /100 | #300 | Tragic $84,890 |
| Potawatomi | 0.0 /100 | #301 | Tragic $84,613 |
| Haitians | 0.0 /100 | #302 | Tragic $84,384 |
| Hondurans | 0.0 /100 | #303 | Tragic $84,079 |
| Ottawa | 0.0 /100 | #304 | Tragic $83,953 |
| Chippewa | 0.0 /100 | #305 | Tragic $83,943 |
Demographics Similar to Immigrants from Ireland by Householder Income Ages 45 - 64 years
In terms of householder income ages 45 - 64 years, the demographic groups most similar to Immigrants from Ireland are Immigrants from Israel ($122,893, a difference of 0.11%), Indian (Asian) ($122,343, a difference of 0.34%), Immigrants from Eastern Asia ($122,222, a difference of 0.44%), Immigrants from China ($122,178, a difference of 0.47%), and Cypriot ($123,396, a difference of 0.52%).
| Demographics | Rating | Rank | Householder Income Ages 45 - 64 years |
| Iranians | 100.0 /100 | #6 | Exceptional $129,350 |
| Immigrants | Hong Kong | 100.0 /100 | #7 | Exceptional $127,500 |
| Immigrants | Iran | 100.0 /100 | #8 | Exceptional $126,940 |
| Okinawans | 100.0 /100 | #9 | Exceptional $124,796 |
| Immigrants | South Central Asia | 100.0 /100 | #10 | Exceptional $124,188 |
| Cypriots | 100.0 /100 | #11 | Exceptional $123,396 |
| Immigrants | Israel | 100.0 /100 | #12 | Exceptional $122,893 |
| Immigrants | Ireland | 100.0 /100 | #13 | Exceptional $122,757 |
| Indians (Asian) | 100.0 /100 | #14 | Exceptional $122,343 |
| Immigrants | Eastern Asia | 100.0 /100 | #15 | Exceptional $122,222 |
| Immigrants | China | 100.0 /100 | #16 | Exceptional $122,178 |
| Burmese | 100.0 /100 | #17 | Exceptional $121,444 |
| Immigrants | Korea | 100.0 /100 | #18 | Exceptional $121,243 |
| Eastern Europeans | 100.0 /100 | #19 | Exceptional $120,684 |
| Immigrants | Australia | 100.0 /100 | #20 | Exceptional $119,308 |