Alsatian vs Japanese Householder Income Ages 25 - 44 years
COMPARE
Alsatian
Japanese
Householder Income Ages 25 - 44 years
Householder Income Ages 25 - 44 years Comparison
Alsatians
Japanese
$95,059
HOUSEHOLDER INCOME AGES 25 - 44 YEARS
56.8/ 100
METRIC RATING
168th/ 347
METRIC RANK
$91,624
HOUSEHOLDER INCOME AGES 25 - 44 YEARS
16.4/ 100
METRIC RATING
201st/ 347
METRIC RANK
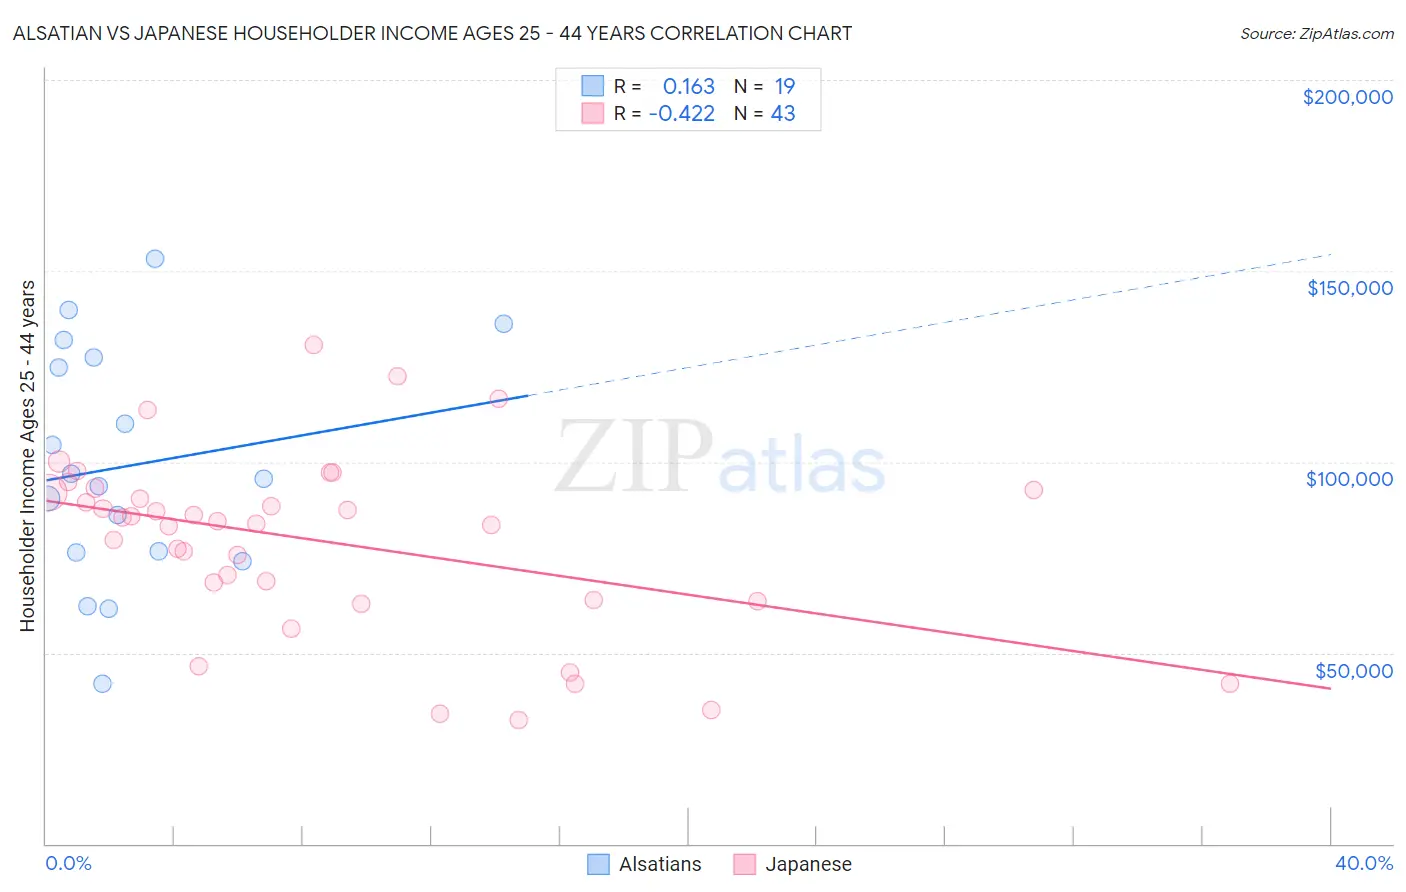
Alsatian vs Japanese Householder Income Ages 25 - 44 years Correlation Chart
The statistical analysis conducted on geographies consisting of 82,595,947 people shows a poor positive correlation between the proportion of Alsatians and household income with householder between the ages 25 and 44 in the United States with a correlation coefficient (R) of 0.163 and weighted average of $95,059. Similarly, the statistical analysis conducted on geographies consisting of 248,932,234 people shows a moderate negative correlation between the proportion of Japanese and household income with householder between the ages 25 and 44 in the United States with a correlation coefficient (R) of -0.422 and weighted average of $91,624, a difference of 3.7%.
Householder Income Ages 25 - 44 years Correlation Summary
| Measurement | Alsatian | Japanese |
| Minimum | $42,026 | $32,434 |
| Maximum | $153,077 | $130,694 |
| Range | $111,051 | $98,260 |
| Mean | $99,110 | $79,326 |
| Median | $95,529 | $84,545 |
| Interquartile 25% (IQ1) | $76,336 | $63,836 |
| Interquartile 75% (IQ3) | $127,229 | $92,776 |
| Interquartile Range (IQR) | $50,893 | $28,940 |
| Standard Deviation (Sample) | $30,381 | $23,298 |
| Standard Deviation (Population) | $29,570 | $23,025 |
Similar Demographics by Householder Income Ages 25 - 44 years
Demographics Similar to Alsatians by Householder Income Ages 25 - 44 years
In terms of householder income ages 25 - 44 years, the demographic groups most similar to Alsatians are Native Hawaiian ($95,058, a difference of 0.0%), Czechoslovakian ($95,070, a difference of 0.010%), Slovak ($95,032, a difference of 0.030%), Immigrants from Armenia ($94,867, a difference of 0.20%), and Immigrants from Ethiopia ($95,256, a difference of 0.21%).
| Demographics | Rating | Rank | Householder Income Ages 25 - 44 years |
| Immigrants | Portugal | 62.8 /100 | #161 | Good $95,512 |
| Swiss | 62.8 /100 | #162 | Good $95,511 |
| Immigrants | Saudi Arabia | 62.0 /100 | #163 | Good $95,450 |
| South Americans | 60.9 /100 | #164 | Good $95,362 |
| Immigrants | Nepal | 60.3 /100 | #165 | Good $95,322 |
| Immigrants | Ethiopia | 59.5 /100 | #166 | Average $95,256 |
| Czechoslovakians | 57.0 /100 | #167 | Average $95,070 |
| Alsatians | 56.8 /100 | #168 | Average $95,059 |
| Native Hawaiians | 56.8 /100 | #169 | Average $95,058 |
| Slovaks | 56.4 /100 | #170 | Average $95,032 |
| Immigrants | Armenia | 54.2 /100 | #171 | Average $94,867 |
| Scottish | 50.8 /100 | #172 | Average $94,622 |
| Finns | 50.6 /100 | #173 | Average $94,610 |
| Colombians | 50.0 /100 | #174 | Average $94,565 |
| English | 48.1 /100 | #175 | Average $94,429 |
Demographics Similar to Japanese by Householder Income Ages 25 - 44 years
In terms of householder income ages 25 - 44 years, the demographic groups most similar to Japanese are White/Caucasian ($91,668, a difference of 0.050%), Ecuadorian ($91,574, a difference of 0.050%), Kenyan ($91,684, a difference of 0.070%), Immigrants from Cambodia ($91,533, a difference of 0.10%), and Nepalese ($91,498, a difference of 0.14%).
| Demographics | Rating | Rank | Householder Income Ages 25 - 44 years |
| Immigrants | Azores | 22.4 /100 | #194 | Fair $92,322 |
| Celtics | 21.6 /100 | #195 | Fair $92,241 |
| Immigrants | Colombia | 21.3 /100 | #196 | Fair $92,204 |
| Spanish | 21.2 /100 | #197 | Fair $92,200 |
| Vietnamese | 20.2 /100 | #198 | Fair $92,089 |
| Kenyans | 16.8 /100 | #199 | Poor $91,684 |
| Whites/Caucasians | 16.7 /100 | #200 | Poor $91,668 |
| Japanese | 16.4 /100 | #201 | Poor $91,624 |
| Ecuadorians | 16.0 /100 | #202 | Poor $91,574 |
| Immigrants | Cambodia | 15.7 /100 | #203 | Poor $91,533 |
| Nepalese | 15.4 /100 | #204 | Poor $91,498 |
| Immigrants | Eastern Africa | 15.2 /100 | #205 | Poor $91,458 |
| Aleuts | 14.5 /100 | #206 | Poor $91,370 |
| Yugoslavians | 14.5 /100 | #207 | Poor $91,368 |
| Immigrants | Thailand | 14.3 /100 | #208 | Poor $91,337 |