Alsatian vs Immigrants from Iran Householder Income Ages 25 - 44 years
COMPARE
Alsatian
Immigrants from Iran
Householder Income Ages 25 - 44 years
Householder Income Ages 25 - 44 years Comparison
Alsatians
Immigrants from Iran
$95,059
HOUSEHOLDER INCOME AGES 25 - 44 YEARS
56.8/ 100
METRIC RATING
168th/ 347
METRIC RANK
$119,204
HOUSEHOLDER INCOME AGES 25 - 44 YEARS
100.0/ 100
METRIC RATING
12th/ 347
METRIC RANK
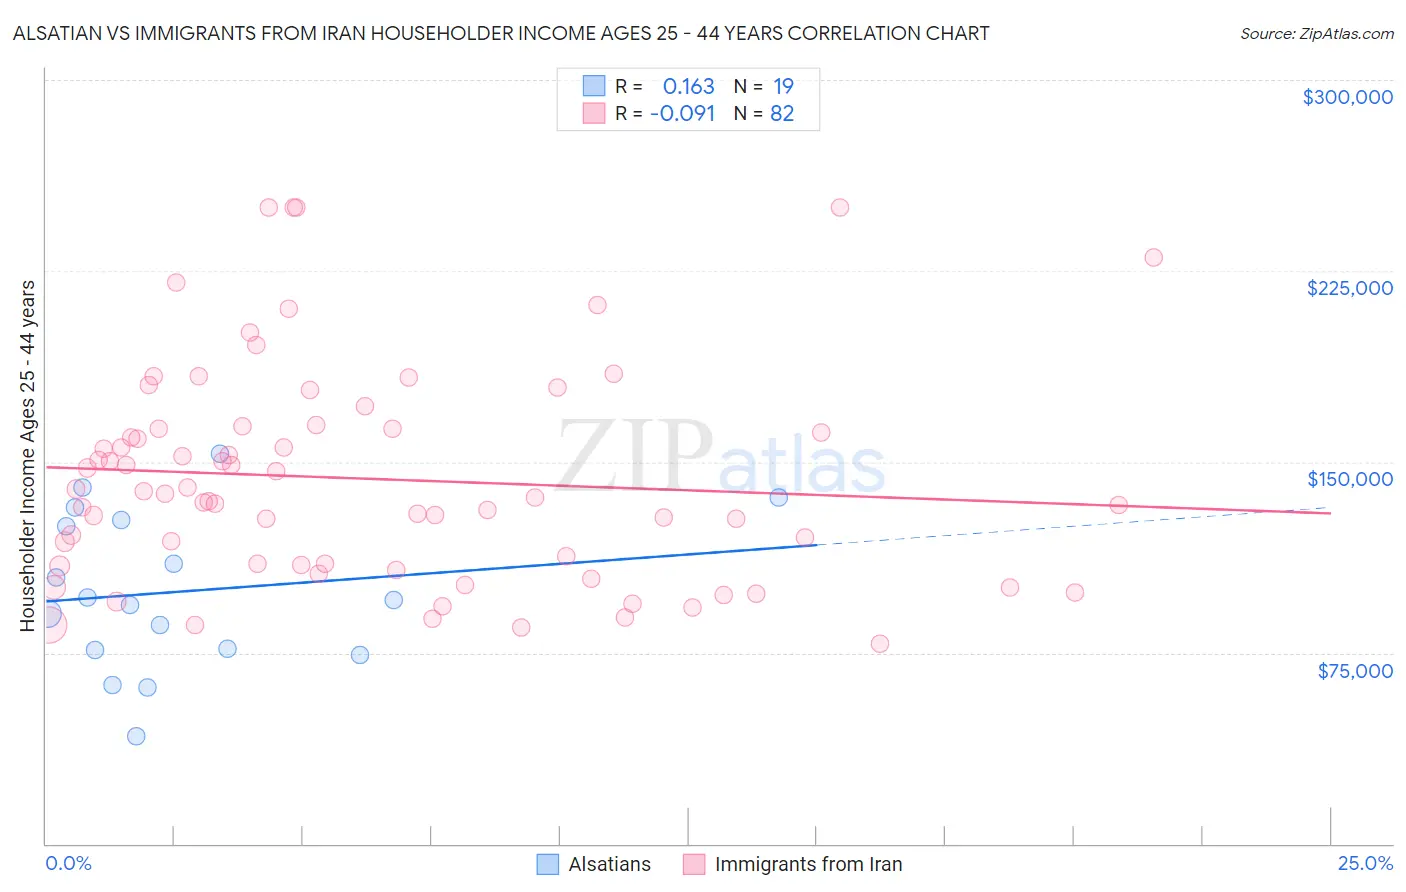
Alsatian vs Immigrants from Iran Householder Income Ages 25 - 44 years Correlation Chart
The statistical analysis conducted on geographies consisting of 82,595,947 people shows a poor positive correlation between the proportion of Alsatians and household income with householder between the ages 25 and 44 in the United States with a correlation coefficient (R) of 0.163 and weighted average of $95,059. Similarly, the statistical analysis conducted on geographies consisting of 279,573,496 people shows a slight negative correlation between the proportion of Immigrants from Iran and household income with householder between the ages 25 and 44 in the United States with a correlation coefficient (R) of -0.091 and weighted average of $119,204, a difference of 25.4%.
Householder Income Ages 25 - 44 years Correlation Summary
| Measurement | Alsatian | Immigrants from Iran |
| Minimum | $42,026 | $78,352 |
| Maximum | $153,077 | $250,001 |
| Range | $111,051 | $171,649 |
| Mean | $99,110 | $143,389 |
| Median | $95,529 | $136,696 |
| Interquartile 25% (IQ1) | $76,336 | $109,520 |
| Interquartile 75% (IQ3) | $127,229 | $163,202 |
| Interquartile Range (IQR) | $50,893 | $53,682 |
| Standard Deviation (Sample) | $30,381 | $42,216 |
| Standard Deviation (Population) | $29,570 | $41,958 |
Similar Demographics by Householder Income Ages 25 - 44 years
Demographics Similar to Alsatians by Householder Income Ages 25 - 44 years
In terms of householder income ages 25 - 44 years, the demographic groups most similar to Alsatians are Native Hawaiian ($95,058, a difference of 0.0%), Czechoslovakian ($95,070, a difference of 0.010%), Slovak ($95,032, a difference of 0.030%), Immigrants from Armenia ($94,867, a difference of 0.20%), and Immigrants from Ethiopia ($95,256, a difference of 0.21%).
| Demographics | Rating | Rank | Householder Income Ages 25 - 44 years |
| Immigrants | Portugal | 62.8 /100 | #161 | Good $95,512 |
| Swiss | 62.8 /100 | #162 | Good $95,511 |
| Immigrants | Saudi Arabia | 62.0 /100 | #163 | Good $95,450 |
| South Americans | 60.9 /100 | #164 | Good $95,362 |
| Immigrants | Nepal | 60.3 /100 | #165 | Good $95,322 |
| Immigrants | Ethiopia | 59.5 /100 | #166 | Average $95,256 |
| Czechoslovakians | 57.0 /100 | #167 | Average $95,070 |
| Alsatians | 56.8 /100 | #168 | Average $95,059 |
| Native Hawaiians | 56.8 /100 | #169 | Average $95,058 |
| Slovaks | 56.4 /100 | #170 | Average $95,032 |
| Immigrants | Armenia | 54.2 /100 | #171 | Average $94,867 |
| Scottish | 50.8 /100 | #172 | Average $94,622 |
| Finns | 50.6 /100 | #173 | Average $94,610 |
| Colombians | 50.0 /100 | #174 | Average $94,565 |
| English | 48.1 /100 | #175 | Average $94,429 |
Demographics Similar to Immigrants from Iran by Householder Income Ages 25 - 44 years
In terms of householder income ages 25 - 44 years, the demographic groups most similar to Immigrants from Iran are Okinawan ($119,349, a difference of 0.12%), Indian (Asian) ($119,496, a difference of 0.25%), Immigrants from China ($119,756, a difference of 0.46%), Iranian ($120,292, a difference of 0.91%), and Immigrants from Ireland ($120,333, a difference of 0.95%).
| Demographics | Rating | Rank | Householder Income Ages 25 - 44 years |
| Immigrants | India | 100.0 /100 | #5 | Exceptional $124,238 |
| Thais | 100.0 /100 | #6 | Exceptional $121,778 |
| Immigrants | Ireland | 100.0 /100 | #7 | Exceptional $120,333 |
| Iranians | 100.0 /100 | #8 | Exceptional $120,292 |
| Immigrants | China | 100.0 /100 | #9 | Exceptional $119,756 |
| Indians (Asian) | 100.0 /100 | #10 | Exceptional $119,496 |
| Okinawans | 100.0 /100 | #11 | Exceptional $119,349 |
| Immigrants | Iran | 100.0 /100 | #12 | Exceptional $119,204 |
| Immigrants | Eastern Asia | 100.0 /100 | #13 | Exceptional $118,056 |
| Immigrants | Israel | 100.0 /100 | #14 | Exceptional $117,219 |
| Immigrants | South Central Asia | 100.0 /100 | #15 | Exceptional $116,626 |
| Cypriots | 100.0 /100 | #16 | Exceptional $116,364 |
| Immigrants | Australia | 100.0 /100 | #17 | Exceptional $115,947 |
| Eastern Europeans | 100.0 /100 | #18 | Exceptional $114,523 |
| Burmese | 100.0 /100 | #19 | Exceptional $113,701 |