Kenyan vs Spanish Householder Income Under 25 years
COMPARE
Kenyan
Spanish
Householder Income Under 25 years
Householder Income Under 25 years Comparison
Kenyans
Spanish
$50,815
HOUSEHOLDER INCOME UNDER 25 YEARS
3.3/ 100
METRIC RATING
234th/ 347
METRIC RANK
$50,813
HOUSEHOLDER INCOME UNDER 25 YEARS
3.3/ 100
METRIC RATING
235th/ 347
METRIC RANK
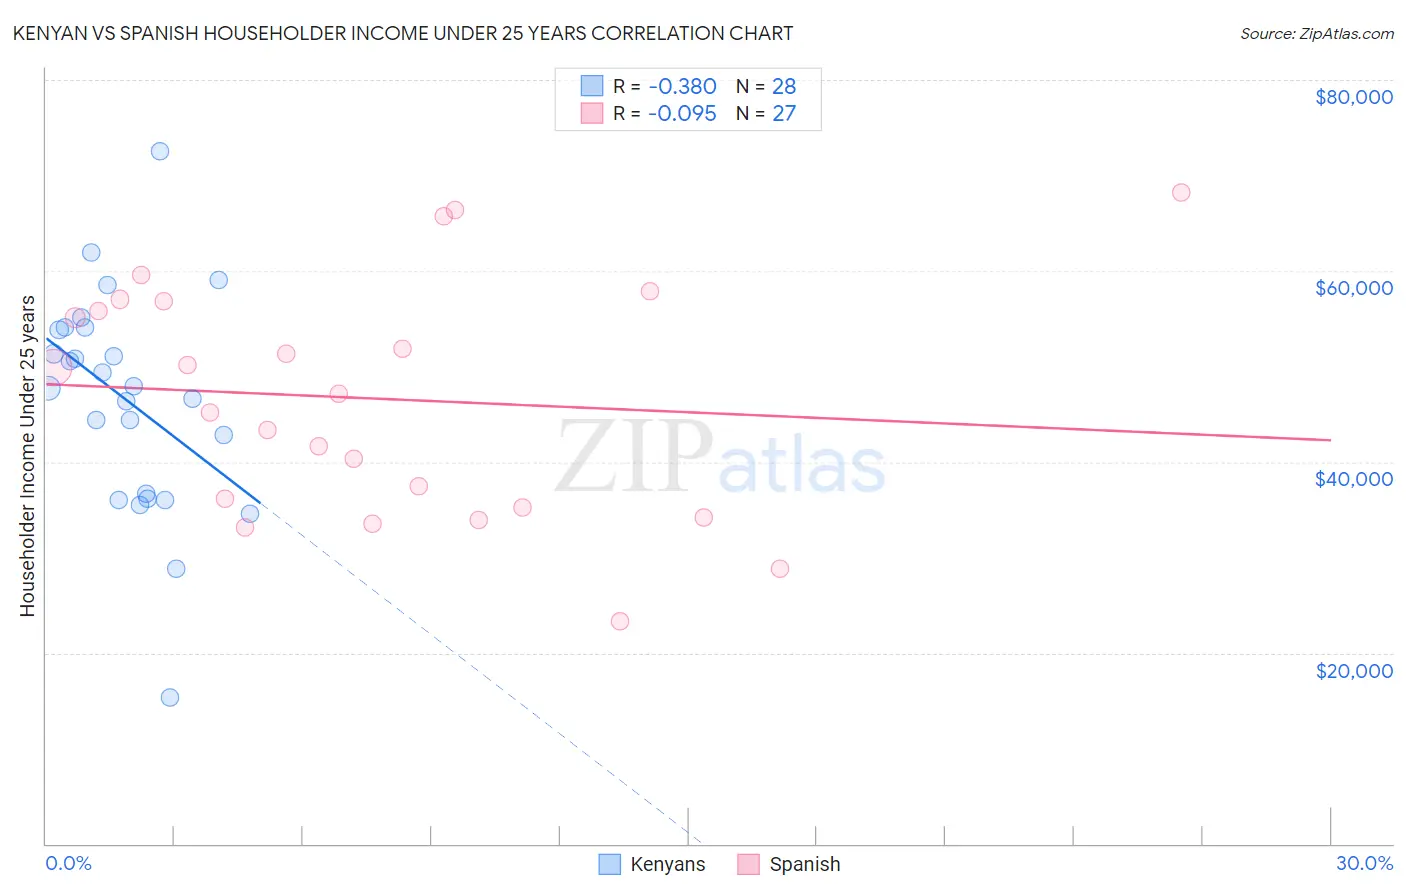
Kenyan vs Spanish Householder Income Under 25 years Correlation Chart
The statistical analysis conducted on geographies consisting of 155,087,002 people shows a mild negative correlation between the proportion of Kenyans and household income with householder under the age of 25 in the United States with a correlation coefficient (R) of -0.380 and weighted average of $50,815. Similarly, the statistical analysis conducted on geographies consisting of 354,725,982 people shows a slight negative correlation between the proportion of Spanish and household income with householder under the age of 25 in the United States with a correlation coefficient (R) of -0.095 and weighted average of $50,813, a difference of 0.0%.
Householder Income Under 25 years Correlation Summary
| Measurement | Kenyan | Spanish |
| Minimum | $15,272 | $23,340 |
| Maximum | $72,514 | $68,194 |
| Range | $57,242 | $44,854 |
| Mean | $46,465 | $46,630 |
| Median | $47,808 | $47,181 |
| Interquartile 25% (IQ1) | $36,370 | $35,245 |
| Interquartile 75% (IQ3) | $53,945 | $56,851 |
| Interquartile Range (IQR) | $17,574 | $21,606 |
| Standard Deviation (Sample) | $11,475 | $12,229 |
| Standard Deviation (Population) | $11,268 | $12,001 |
Demographics Similar to Kenyans and Spanish by Householder Income Under 25 years
In terms of householder income under 25 years, the demographic groups most similar to Kenyans are English ($50,805, a difference of 0.020%), German ($50,804, a difference of 0.020%), Iraqi ($50,802, a difference of 0.030%), Pennsylvania German ($50,852, a difference of 0.070%), and Immigrants from Caribbean ($50,757, a difference of 0.11%). Similarly, the demographic groups most similar to Spanish are English ($50,805, a difference of 0.020%), German ($50,804, a difference of 0.020%), Iraqi ($50,802, a difference of 0.020%), Pennsylvania German ($50,852, a difference of 0.080%), and Immigrants from Caribbean ($50,757, a difference of 0.11%).
| Demographics | Rating | Rank | Householder Income Under 25 years |
| Belizeans | 6.4 /100 | #224 | Tragic $51,094 |
| Immigrants | Jamaica | 5.6 /100 | #225 | Tragic $51,038 |
| Yugoslavians | 5.5 /100 | #226 | Tragic $51,028 |
| Immigrants | Central America | 5.4 /100 | #227 | Tragic $51,022 |
| Immigrants | Norway | 5.0 /100 | #228 | Tragic $50,984 |
| Yuman | 4.4 /100 | #229 | Tragic $50,933 |
| Jamaicans | 4.4 /100 | #230 | Tragic $50,929 |
| Ugandans | 4.3 /100 | #231 | Tragic $50,923 |
| Slovenes | 4.0 /100 | #232 | Tragic $50,886 |
| Pennsylvania Germans | 3.7 /100 | #233 | Tragic $50,852 |
| Kenyans | 3.3 /100 | #234 | Tragic $50,815 |
| Spanish | 3.3 /100 | #235 | Tragic $50,813 |
| English | 3.3 /100 | #236 | Tragic $50,805 |
| Germans | 3.3 /100 | #237 | Tragic $50,804 |
| Iraqis | 3.2 /100 | #238 | Tragic $50,802 |
| Immigrants | Caribbean | 2.9 /100 | #239 | Tragic $50,757 |
| Immigrants | Lebanon | 2.7 /100 | #240 | Tragic $50,729 |
| Immigrants | Micronesia | 2.5 /100 | #241 | Tragic $50,691 |
| Cubans | 2.3 /100 | #242 | Tragic $50,655 |
| Immigrants | Thailand | 2.2 /100 | #243 | Tragic $50,645 |
| Marshallese | 2.1 /100 | #244 | Tragic $50,627 |