Ugandan vs Korean Median Earnings
COMPARE
Ugandan
Korean
Median Earnings
Median Earnings Comparison
Ugandans
Koreans
$47,854
MEDIAN EARNINGS
88.0/ 100
METRIC RATING
142nd/ 347
METRIC RANK
$48,727
MEDIAN EARNINGS
96.2/ 100
METRIC RATING
116th/ 347
METRIC RANK
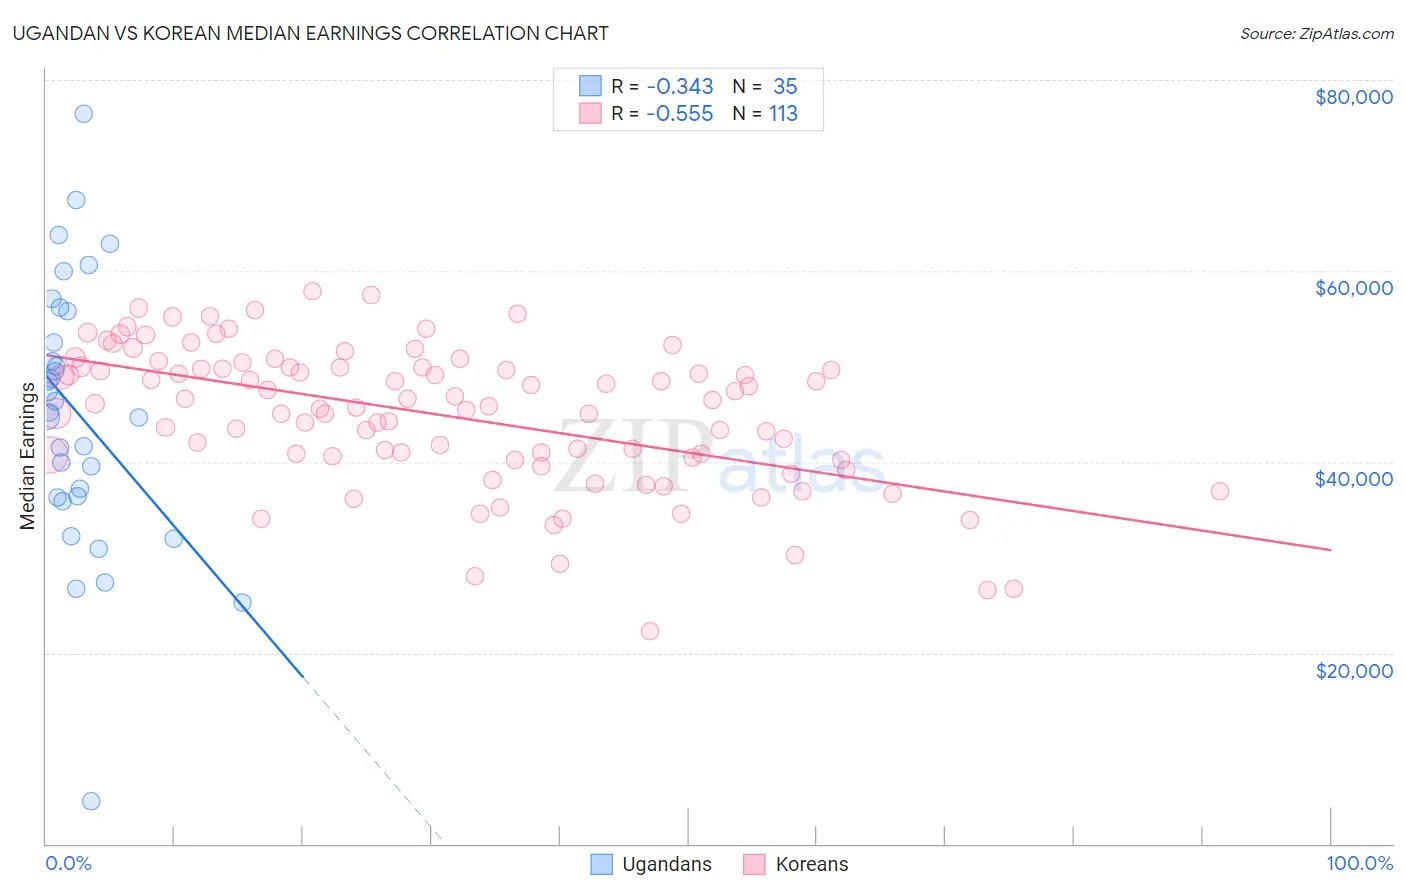
Ugandan vs Korean Median Earnings Correlation Chart
The statistical analysis conducted on geographies consisting of 94,012,409 people shows a mild negative correlation between the proportion of Ugandans and median earnings in the United States with a correlation coefficient (R) of -0.343 and weighted average of $47,854. Similarly, the statistical analysis conducted on geographies consisting of 510,900,863 people shows a substantial negative correlation between the proportion of Koreans and median earnings in the United States with a correlation coefficient (R) of -0.555 and weighted average of $48,727, a difference of 1.8%.
Median Earnings Correlation Summary
| Measurement | Ugandan | Korean |
| Minimum | $4,426 | $22,216 |
| Maximum | $76,513 | $57,875 |
| Range | $72,087 | $35,659 |
| Mean | $45,002 | $44,924 |
| Median | $45,167 | $46,110 |
| Interquartile 25% (IQ1) | $36,215 | $40,528 |
| Interquartile 75% (IQ3) | $55,750 | $49,935 |
| Interquartile Range (IQR) | $19,535 | $9,407 |
| Standard Deviation (Sample) | $14,118 | $7,353 |
| Standard Deviation (Population) | $13,915 | $7,320 |
Similar Demographics by Median Earnings
Demographics Similar to Ugandans by Median Earnings
In terms of median earnings, the demographic groups most similar to Ugandans are Swedish ($47,851, a difference of 0.010%), Immigrants from Sierra Leone ($47,875, a difference of 0.040%), Taiwanese ($47,902, a difference of 0.10%), Canadian ($47,911, a difference of 0.12%), and Hungarian ($47,795, a difference of 0.12%).
| Demographics | Rating | Rank | Median Earnings |
| Portuguese | 90.4 /100 | #135 | Exceptional $48,032 |
| Slovenes | 90.0 /100 | #136 | Excellent $47,995 |
| Immigrants | Nepal | 89.0 /100 | #137 | Excellent $47,925 |
| Europeans | 88.9 /100 | #138 | Excellent $47,915 |
| Canadians | 88.8 /100 | #139 | Excellent $47,911 |
| Taiwanese | 88.7 /100 | #140 | Excellent $47,902 |
| Immigrants | Sierra Leone | 88.3 /100 | #141 | Excellent $47,875 |
| Ugandans | 88.0 /100 | #142 | Excellent $47,854 |
| Swedes | 88.0 /100 | #143 | Excellent $47,851 |
| Hungarians | 87.1 /100 | #144 | Excellent $47,795 |
| Immigrants | Saudi Arabia | 85.6 /100 | #145 | Excellent $47,704 |
| Immigrants | Chile | 85.5 /100 | #146 | Excellent $47,697 |
| Immigrants | South Eastern Asia | 85.0 /100 | #147 | Excellent $47,671 |
| Immigrants | Eritrea | 84.8 /100 | #148 | Excellent $47,657 |
| Luxembourgers | 84.5 /100 | #149 | Excellent $47,640 |
Demographics Similar to Koreans by Median Earnings
In terms of median earnings, the demographic groups most similar to Koreans are Serbian ($48,677, a difference of 0.10%), Immigrants from Jordan ($48,673, a difference of 0.11%), Polish ($48,659, a difference of 0.14%), Chinese ($48,836, a difference of 0.22%), and Moroccan ($48,838, a difference of 0.23%).
| Demographics | Rating | Rank | Median Earnings |
| Syrians | 97.1 /100 | #109 | Exceptional $48,934 |
| Immigrants | Ethiopia | 97.1 /100 | #110 | Exceptional $48,924 |
| Immigrants | Zimbabwe | 97.0 /100 | #111 | Exceptional $48,913 |
| Northern Europeans | 96.9 /100 | #112 | Exceptional $48,887 |
| Immigrants | Kuwait | 96.8 /100 | #113 | Exceptional $48,861 |
| Moroccans | 96.7 /100 | #114 | Exceptional $48,838 |
| Chinese | 96.7 /100 | #115 | Exceptional $48,836 |
| Koreans | 96.2 /100 | #116 | Exceptional $48,727 |
| Serbians | 95.9 /100 | #117 | Exceptional $48,677 |
| Immigrants | Jordan | 95.9 /100 | #118 | Exceptional $48,673 |
| Poles | 95.8 /100 | #119 | Exceptional $48,659 |
| Carpatho Rusyns | 95.5 /100 | #120 | Exceptional $48,617 |
| Arabs | 95.4 /100 | #121 | Exceptional $48,599 |
| Chileans | 94.8 /100 | #122 | Exceptional $48,504 |
| Immigrants | Syria | 93.9 /100 | #123 | Exceptional $48,375 |