Aleut vs Argentinean Householder Income Ages 25 - 44 years
COMPARE
Aleut
Argentinean
Householder Income Ages 25 - 44 years
Householder Income Ages 25 - 44 years Comparison
Aleuts
Argentineans
$91,370
HOUSEHOLDER INCOME AGES 25 - 44 YEARS
14.5/ 100
METRIC RATING
206th/ 347
METRIC RANK
$103,111
HOUSEHOLDER INCOME AGES 25 - 44 YEARS
99.1/ 100
METRIC RATING
83rd/ 347
METRIC RANK
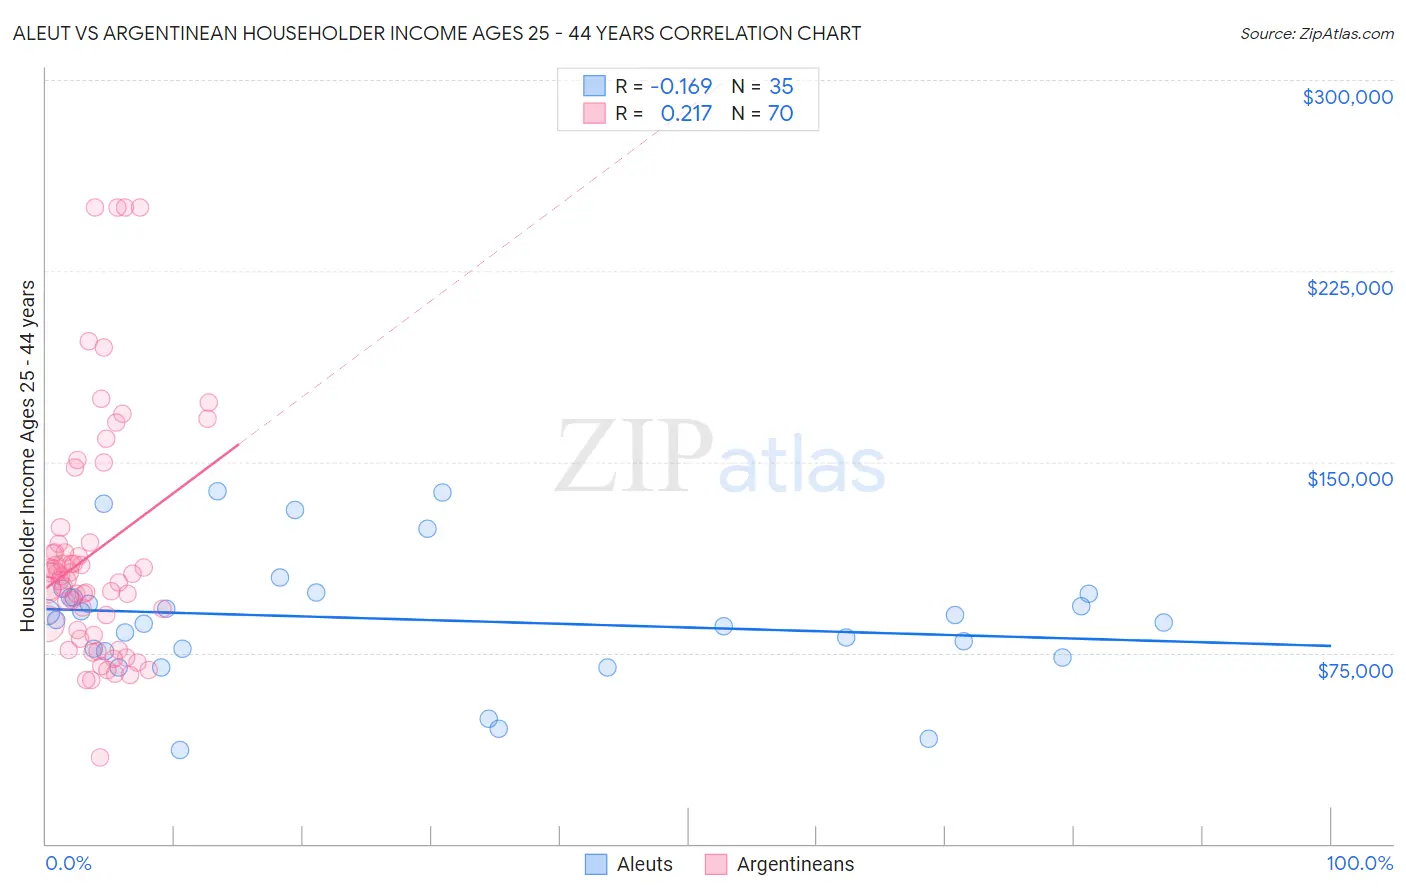
Aleut vs Argentinean Householder Income Ages 25 - 44 years Correlation Chart
The statistical analysis conducted on geographies consisting of 61,739,915 people shows a poor negative correlation between the proportion of Aleuts and household income with householder between the ages 25 and 44 in the United States with a correlation coefficient (R) of -0.169 and weighted average of $91,370. Similarly, the statistical analysis conducted on geographies consisting of 296,719,437 people shows a weak positive correlation between the proportion of Argentineans and household income with householder between the ages 25 and 44 in the United States with a correlation coefficient (R) of 0.217 and weighted average of $103,111, a difference of 12.9%.
Householder Income Ages 25 - 44 years Correlation Summary
| Measurement | Aleut | Argentinean |
| Minimum | $36,667 | $33,750 |
| Maximum | $138,313 | $250,001 |
| Range | $101,646 | $216,251 |
| Mean | $88,134 | $114,200 |
| Median | $88,006 | $104,423 |
| Interquartile 25% (IQ1) | $75,410 | $84,111 |
| Interquartile 75% (IQ3) | $98,125 | $117,920 |
| Interquartile Range (IQR) | $22,715 | $33,809 |
| Standard Deviation (Sample) | $24,944 | $46,765 |
| Standard Deviation (Population) | $24,585 | $46,430 |
Similar Demographics by Householder Income Ages 25 - 44 years
Demographics Similar to Aleuts by Householder Income Ages 25 - 44 years
In terms of householder income ages 25 - 44 years, the demographic groups most similar to Aleuts are Yugoslavian ($91,368, a difference of 0.0%), Immigrants from Thailand ($91,337, a difference of 0.040%), Immigrants from Eastern Africa ($91,458, a difference of 0.10%), Nepalese ($91,498, a difference of 0.14%), and Immigrants from Cambodia ($91,533, a difference of 0.18%).
| Demographics | Rating | Rank | Householder Income Ages 25 - 44 years |
| Kenyans | 16.8 /100 | #199 | Poor $91,684 |
| Whites/Caucasians | 16.7 /100 | #200 | Poor $91,668 |
| Japanese | 16.4 /100 | #201 | Poor $91,624 |
| Ecuadorians | 16.0 /100 | #202 | Poor $91,574 |
| Immigrants | Cambodia | 15.7 /100 | #203 | Poor $91,533 |
| Nepalese | 15.4 /100 | #204 | Poor $91,498 |
| Immigrants | Eastern Africa | 15.2 /100 | #205 | Poor $91,458 |
| Aleuts | 14.5 /100 | #206 | Poor $91,370 |
| Yugoslavians | 14.5 /100 | #207 | Poor $91,368 |
| Immigrants | Thailand | 14.3 /100 | #208 | Poor $91,337 |
| Immigrants | Uruguay | 13.2 /100 | #209 | Poor $91,171 |
| Immigrants | Kenya | 10.9 /100 | #210 | Poor $90,767 |
| Iraqis | 10.8 /100 | #211 | Poor $90,764 |
| Hawaiians | 10.6 /100 | #212 | Poor $90,722 |
| Immigrants | Bangladesh | 9.3 /100 | #213 | Tragic $90,448 |
Demographics Similar to Argentineans by Householder Income Ages 25 - 44 years
In terms of householder income ages 25 - 44 years, the demographic groups most similar to Argentineans are Immigrants from Serbia ($103,155, a difference of 0.040%), South African ($103,160, a difference of 0.050%), Immigrants from Egypt ($103,192, a difference of 0.080%), Armenian ($103,248, a difference of 0.13%), and Immigrants from Philippines ($102,910, a difference of 0.20%).
| Demographics | Rating | Rank | Householder Income Ages 25 - 44 years |
| Immigrants | Spain | 99.4 /100 | #76 | Exceptional $103,752 |
| Immigrants | Southern Europe | 99.3 /100 | #77 | Exceptional $103,486 |
| Immigrants | Bulgaria | 99.3 /100 | #78 | Exceptional $103,423 |
| Armenians | 99.2 /100 | #79 | Exceptional $103,248 |
| Immigrants | Egypt | 99.2 /100 | #80 | Exceptional $103,192 |
| South Africans | 99.2 /100 | #81 | Exceptional $103,160 |
| Immigrants | Serbia | 99.2 /100 | #82 | Exceptional $103,155 |
| Argentineans | 99.1 /100 | #83 | Exceptional $103,111 |
| Immigrants | Philippines | 99.0 /100 | #84 | Exceptional $102,910 |
| Immigrants | Ukraine | 98.9 /100 | #85 | Exceptional $102,664 |
| Immigrants | Hungary | 98.9 /100 | #86 | Exceptional $102,655 |
| Immigrants | Western Europe | 98.9 /100 | #87 | Exceptional $102,654 |
| Immigrants | Canada | 98.9 /100 | #88 | Exceptional $102,616 |
| Romanians | 98.8 /100 | #89 | Exceptional $102,544 |
| Ukrainians | 98.8 /100 | #90 | Exceptional $102,451 |