Aleut vs Immigrants from Africa Householder Income Ages 25 - 44 years
COMPARE
Aleut
Immigrants from Africa
Householder Income Ages 25 - 44 years
Householder Income Ages 25 - 44 years Comparison
Aleuts
Immigrants from Africa
$91,370
HOUSEHOLDER INCOME AGES 25 - 44 YEARS
14.5/ 100
METRIC RATING
206th/ 347
METRIC RANK
$90,372
HOUSEHOLDER INCOME AGES 25 - 44 YEARS
8.9/ 100
METRIC RATING
214th/ 347
METRIC RANK
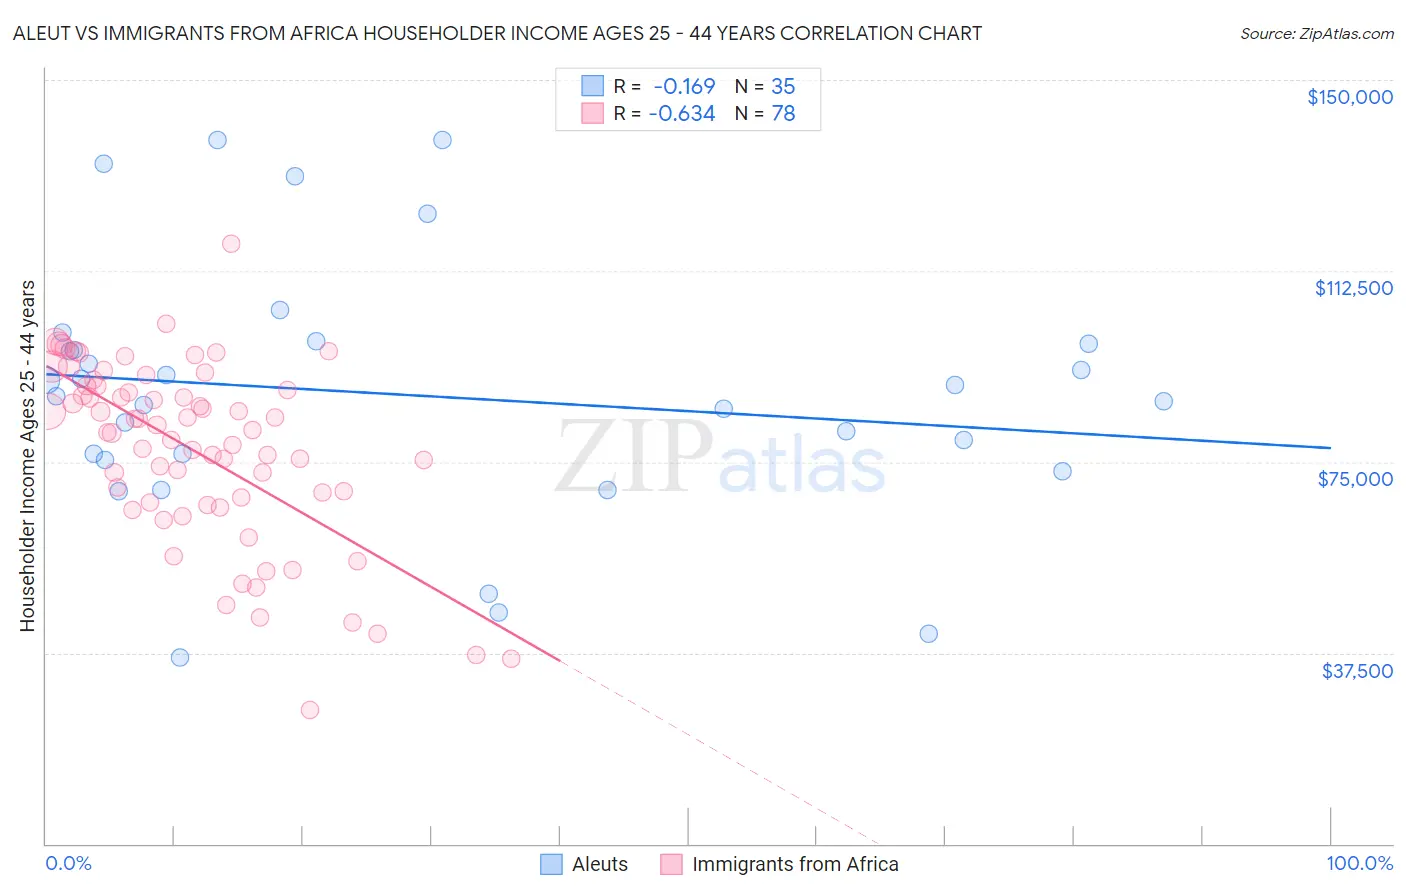
Aleut vs Immigrants from Africa Householder Income Ages 25 - 44 years Correlation Chart
The statistical analysis conducted on geographies consisting of 61,739,915 people shows a poor negative correlation between the proportion of Aleuts and household income with householder between the ages 25 and 44 in the United States with a correlation coefficient (R) of -0.169 and weighted average of $91,370. Similarly, the statistical analysis conducted on geographies consisting of 467,630,423 people shows a significant negative correlation between the proportion of Immigrants from Africa and household income with householder between the ages 25 and 44 in the United States with a correlation coefficient (R) of -0.634 and weighted average of $90,372, a difference of 1.1%.
Householder Income Ages 25 - 44 years Correlation Summary
| Measurement | Aleut | Immigrants from Africa |
| Minimum | $36,667 | $26,250 |
| Maximum | $138,313 | $117,804 |
| Range | $101,646 | $91,554 |
| Mean | $88,134 | $77,244 |
| Median | $88,006 | $81,060 |
| Interquartile 25% (IQ1) | $75,410 | $67,103 |
| Interquartile 75% (IQ3) | $98,125 | $89,908 |
| Interquartile Range (IQR) | $22,715 | $22,805 |
| Standard Deviation (Sample) | $24,944 | $17,876 |
| Standard Deviation (Population) | $24,585 | $17,761 |
Demographics Similar to Aleuts and Immigrants from Africa by Householder Income Ages 25 - 44 years
In terms of householder income ages 25 - 44 years, the demographic groups most similar to Aleuts are Yugoslavian ($91,368, a difference of 0.0%), Immigrants from Thailand ($91,337, a difference of 0.040%), Immigrants from Eastern Africa ($91,458, a difference of 0.10%), Nepalese ($91,498, a difference of 0.14%), and Immigrants from Cambodia ($91,533, a difference of 0.18%). Similarly, the demographic groups most similar to Immigrants from Africa are Immigrants from Bangladesh ($90,448, a difference of 0.090%), Panamanian ($90,193, a difference of 0.20%), Ghanaian ($90,137, a difference of 0.26%), Hawaiian ($90,722, a difference of 0.39%), and Iraqi ($90,764, a difference of 0.43%).
| Demographics | Rating | Rank | Householder Income Ages 25 - 44 years |
| Whites/Caucasians | 16.7 /100 | #200 | Poor $91,668 |
| Japanese | 16.4 /100 | #201 | Poor $91,624 |
| Ecuadorians | 16.0 /100 | #202 | Poor $91,574 |
| Immigrants | Cambodia | 15.7 /100 | #203 | Poor $91,533 |
| Nepalese | 15.4 /100 | #204 | Poor $91,498 |
| Immigrants | Eastern Africa | 15.2 /100 | #205 | Poor $91,458 |
| Aleuts | 14.5 /100 | #206 | Poor $91,370 |
| Yugoslavians | 14.5 /100 | #207 | Poor $91,368 |
| Immigrants | Thailand | 14.3 /100 | #208 | Poor $91,337 |
| Immigrants | Uruguay | 13.2 /100 | #209 | Poor $91,171 |
| Immigrants | Kenya | 10.9 /100 | #210 | Poor $90,767 |
| Iraqis | 10.8 /100 | #211 | Poor $90,764 |
| Hawaiians | 10.6 /100 | #212 | Poor $90,722 |
| Immigrants | Bangladesh | 9.3 /100 | #213 | Tragic $90,448 |
| Immigrants | Africa | 8.9 /100 | #214 | Tragic $90,372 |
| Panamanians | 8.1 /100 | #215 | Tragic $90,193 |
| Ghanaians | 7.9 /100 | #216 | Tragic $90,137 |
| Scotch-Irish | 7.3 /100 | #217 | Tragic $89,969 |
| Guyanese | 7.1 /100 | #218 | Tragic $89,940 |
| Delaware | 6.9 /100 | #219 | Tragic $89,876 |
| Trinidadians and Tobagonians | 6.8 /100 | #220 | Tragic $89,856 |