Albanian vs Paiute Householder Income Ages 25 - 44 years
COMPARE
Albanian
Paiute
Householder Income Ages 25 - 44 years
Householder Income Ages 25 - 44 years Comparison
Albanians
Paiute
$101,367
HOUSEHOLDER INCOME AGES 25 - 44 YEARS
97.8/ 100
METRIC RATING
101st/ 347
METRIC RANK
$82,984
HOUSEHOLDER INCOME AGES 25 - 44 YEARS
0.2/ 100
METRIC RATING
277th/ 347
METRIC RANK
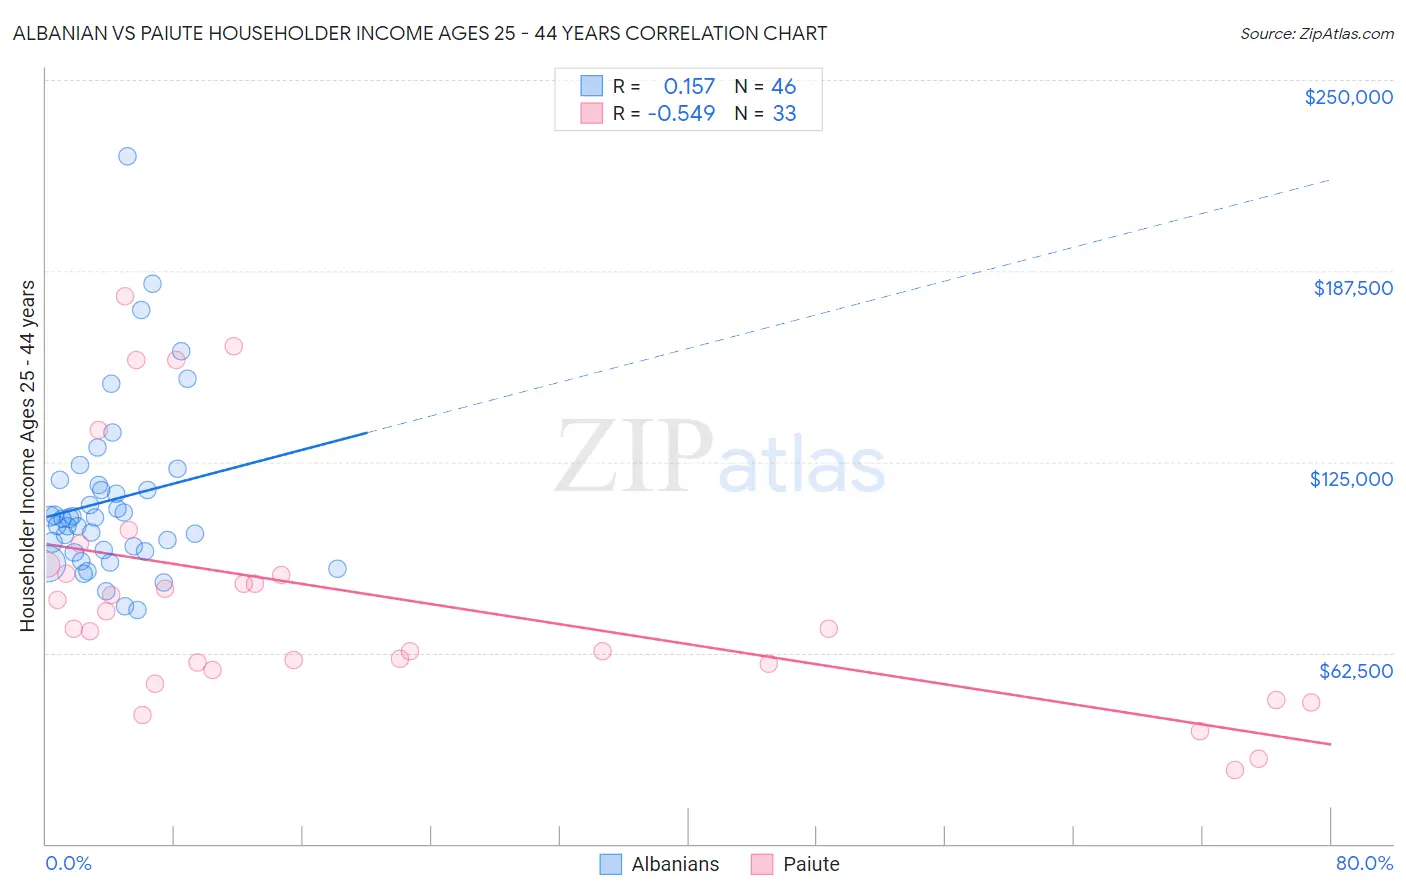
Albanian vs Paiute Householder Income Ages 25 - 44 years Correlation Chart
The statistical analysis conducted on geographies consisting of 193,076,288 people shows a poor positive correlation between the proportion of Albanians and household income with householder between the ages 25 and 44 in the United States with a correlation coefficient (R) of 0.157 and weighted average of $101,367. Similarly, the statistical analysis conducted on geographies consisting of 58,335,630 people shows a substantial negative correlation between the proportion of Paiute and household income with householder between the ages 25 and 44 in the United States with a correlation coefficient (R) of -0.549 and weighted average of $82,984, a difference of 22.2%.
Householder Income Ages 25 - 44 years Correlation Summary
| Measurement | Albanian | Paiute |
| Minimum | $76,718 | $24,091 |
| Maximum | $225,000 | $179,063 |
| Range | $148,282 | $154,972 |
| Mean | $112,576 | $80,693 |
| Median | $106,494 | $70,417 |
| Interquartile 25% (IQ1) | $95,901 | $57,886 |
| Interquartile 75% (IQ3) | $117,313 | $89,878 |
| Interquartile Range (IQR) | $21,412 | $31,992 |
| Standard Deviation (Sample) | $28,766 | $38,861 |
| Standard Deviation (Population) | $28,452 | $38,267 |
Similar Demographics by Householder Income Ages 25 - 44 years
Demographics Similar to Albanians by Householder Income Ages 25 - 44 years
In terms of householder income ages 25 - 44 years, the demographic groups most similar to Albanians are Immigrants from Argentina ($101,415, a difference of 0.050%), Taiwanese ($101,492, a difference of 0.12%), Immigrants from Lebanon ($101,124, a difference of 0.24%), Immigrants from Moldova ($101,091, a difference of 0.27%), and Immigrants from Poland ($101,065, a difference of 0.30%).
| Demographics | Rating | Rank | Householder Income Ages 25 - 44 years |
| Sri Lankans | 98.4 /100 | #94 | Exceptional $101,960 |
| Assyrians/Chaldeans/Syriacs | 98.3 /100 | #95 | Exceptional $101,936 |
| Macedonians | 98.3 /100 | #96 | Exceptional $101,882 |
| Austrians | 98.3 /100 | #97 | Exceptional $101,842 |
| Immigrants | Kazakhstan | 98.1 /100 | #98 | Exceptional $101,727 |
| Taiwanese | 97.9 /100 | #99 | Exceptional $101,492 |
| Immigrants | Argentina | 97.8 /100 | #100 | Exceptional $101,415 |
| Albanians | 97.8 /100 | #101 | Exceptional $101,367 |
| Immigrants | Lebanon | 97.4 /100 | #102 | Exceptional $101,124 |
| Immigrants | Moldova | 97.4 /100 | #103 | Exceptional $101,091 |
| Immigrants | Poland | 97.4 /100 | #104 | Exceptional $101,065 |
| Immigrants | Vietnam | 96.5 /100 | #105 | Exceptional $100,535 |
| Immigrants | Brazil | 96.5 /100 | #106 | Exceptional $100,534 |
| Northern Europeans | 96.3 /100 | #107 | Exceptional $100,457 |
| Immigrants | South Eastern Asia | 96.0 /100 | #108 | Exceptional $100,283 |
Demographics Similar to Paiute by Householder Income Ages 25 - 44 years
In terms of householder income ages 25 - 44 years, the demographic groups most similar to Paiute are Senegalese ($82,852, a difference of 0.16%), Immigrants from Belize ($83,141, a difference of 0.19%), Pima ($82,821, a difference of 0.20%), Immigrants from Jamaica ($83,298, a difference of 0.38%), and Colville ($82,604, a difference of 0.46%).
| Demographics | Rating | Rank | Householder Income Ages 25 - 44 years |
| Jamaicans | 0.3 /100 | #270 | Tragic $83,933 |
| Somalis | 0.2 /100 | #271 | Tragic $83,752 |
| Spanish Americans | 0.2 /100 | #272 | Tragic $83,722 |
| Iroquois | 0.2 /100 | #273 | Tragic $83,682 |
| Marshallese | 0.2 /100 | #274 | Tragic $83,575 |
| Immigrants | Jamaica | 0.2 /100 | #275 | Tragic $83,298 |
| Immigrants | Belize | 0.2 /100 | #276 | Tragic $83,141 |
| Paiute | 0.2 /100 | #277 | Tragic $82,984 |
| Senegalese | 0.2 /100 | #278 | Tragic $82,852 |
| Pima | 0.1 /100 | #279 | Tragic $82,821 |
| Colville | 0.1 /100 | #280 | Tragic $82,604 |
| Cajuns | 0.1 /100 | #281 | Tragic $82,393 |
| Central American Indians | 0.1 /100 | #282 | Tragic $82,355 |
| Guatemalans | 0.1 /100 | #283 | Tragic $82,331 |
| Immigrants | Middle Africa | 0.1 /100 | #284 | Tragic $82,254 |