Albanian vs Haitian Per Capita Income
COMPARE
Albanian
Haitian
Per Capita Income
Per Capita Income Comparison
Albanians
Haitians
$47,379
PER CAPITA INCOME
98.5/ 100
METRIC RATING
94th/ 347
METRIC RANK
$37,289
PER CAPITA INCOME
0.1/ 100
METRIC RATING
297th/ 347
METRIC RANK
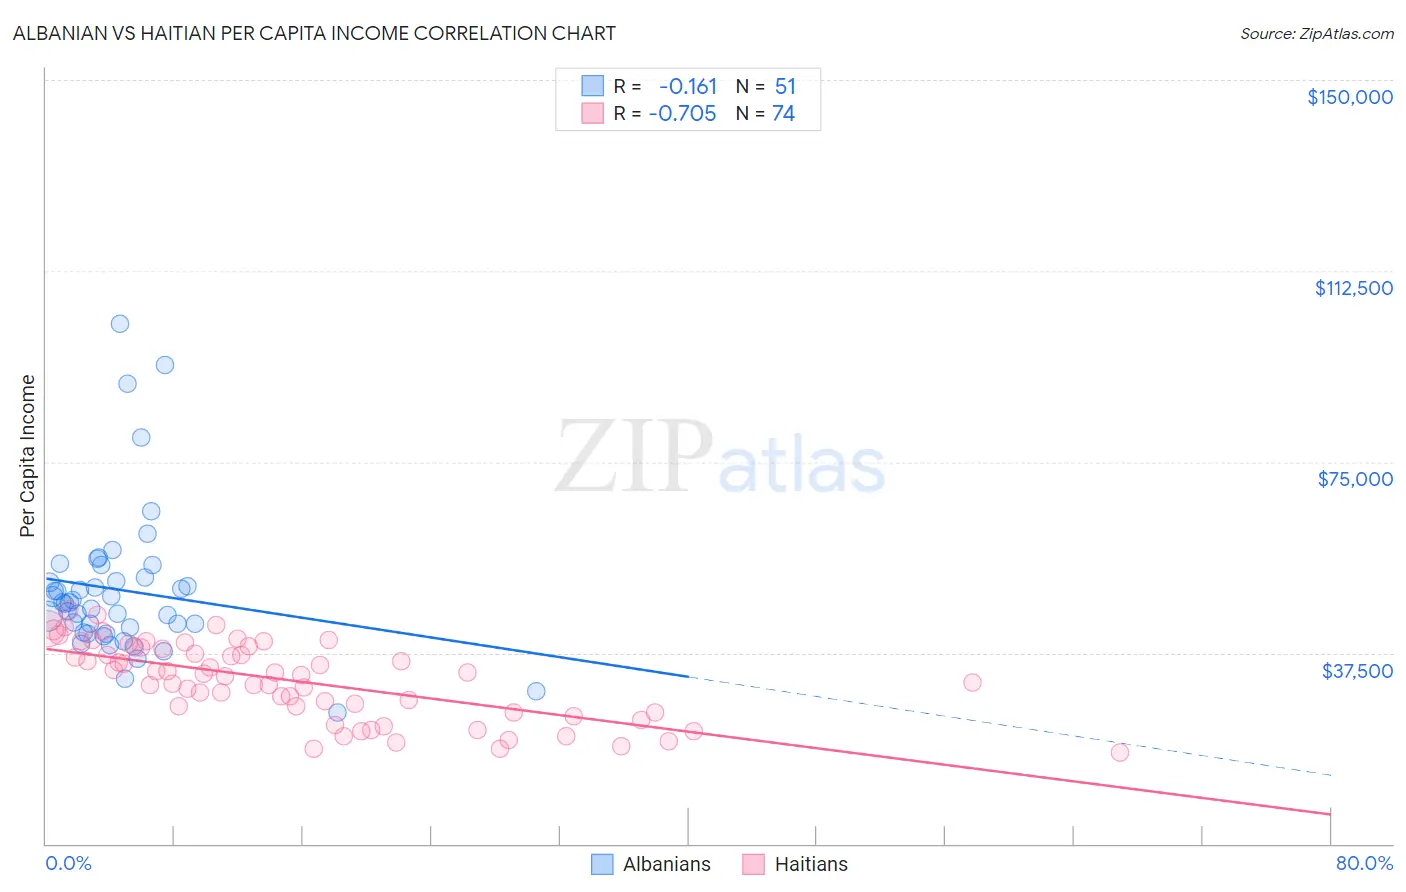
Albanian vs Haitian Per Capita Income Correlation Chart
The statistical analysis conducted on geographies consisting of 193,264,500 people shows a poor negative correlation between the proportion of Albanians and per capita income in the United States with a correlation coefficient (R) of -0.161 and weighted average of $47,379. Similarly, the statistical analysis conducted on geographies consisting of 288,031,086 people shows a strong negative correlation between the proportion of Haitians and per capita income in the United States with a correlation coefficient (R) of -0.705 and weighted average of $37,289, a difference of 27.1%.
Per Capita Income Correlation Summary
| Measurement | Albanian | Haitian |
| Minimum | $25,698 | $17,858 |
| Maximum | $102,102 | $45,871 |
| Range | $76,404 | $28,013 |
| Mean | $49,796 | $31,987 |
| Median | $47,330 | $33,320 |
| Interquartile 25% (IQ1) | $41,568 | $25,885 |
| Interquartile 75% (IQ3) | $52,221 | $38,541 |
| Interquartile Range (IQR) | $10,654 | $12,656 |
| Standard Deviation (Sample) | $14,520 | $7,480 |
| Standard Deviation (Population) | $14,376 | $7,429 |
Similar Demographics by Per Capita Income
Demographics Similar to Albanians by Per Capita Income
In terms of per capita income, the demographic groups most similar to Albanians are Immigrants from Zimbabwe ($47,394, a difference of 0.030%), Immigrants from Egypt ($47,361, a difference of 0.040%), Alsatian ($47,284, a difference of 0.20%), Immigrants from Moldova ($47,489, a difference of 0.23%), and Carpatho Rusyn ($47,248, a difference of 0.28%).
| Demographics | Rating | Rank | Per Capita Income |
| Ukrainians | 99.3 /100 | #87 | Exceptional $48,014 |
| Croatians | 99.0 /100 | #88 | Exceptional $47,742 |
| Northern Europeans | 98.9 /100 | #89 | Exceptional $47,698 |
| Italians | 98.8 /100 | #90 | Exceptional $47,574 |
| Macedonians | 98.8 /100 | #91 | Exceptional $47,573 |
| Immigrants | Moldova | 98.7 /100 | #92 | Exceptional $47,489 |
| Immigrants | Zimbabwe | 98.5 /100 | #93 | Exceptional $47,394 |
| Albanians | 98.5 /100 | #94 | Exceptional $47,379 |
| Immigrants | Egypt | 98.5 /100 | #95 | Exceptional $47,361 |
| Alsatians | 98.3 /100 | #96 | Exceptional $47,284 |
| Carpatho Rusyns | 98.2 /100 | #97 | Exceptional $47,248 |
| Immigrants | Pakistan | 97.9 /100 | #98 | Exceptional $47,084 |
| Laotians | 97.8 /100 | #99 | Exceptional $47,041 |
| Immigrants | Lebanon | 97.5 /100 | #100 | Exceptional $46,938 |
| Immigrants | Uzbekistan | 97.5 /100 | #101 | Exceptional $46,929 |
Demographics Similar to Haitians by Per Capita Income
In terms of per capita income, the demographic groups most similar to Haitians are Indonesian ($37,300, a difference of 0.030%), Immigrants from Dominican Republic ($37,306, a difference of 0.040%), Immigrants from Caribbean ($37,254, a difference of 0.090%), Cherokee ($37,203, a difference of 0.23%), and Cuban ($37,383, a difference of 0.25%).
| Demographics | Rating | Rank | Per Capita Income |
| Immigrants | Guatemala | 0.1 /100 | #290 | Tragic $37,550 |
| Cajuns | 0.1 /100 | #291 | Tragic $37,527 |
| Immigrants | Micronesia | 0.1 /100 | #292 | Tragic $37,464 |
| Mexican American Indians | 0.1 /100 | #293 | Tragic $37,407 |
| Cubans | 0.1 /100 | #294 | Tragic $37,383 |
| Immigrants | Dominican Republic | 0.1 /100 | #295 | Tragic $37,306 |
| Indonesians | 0.1 /100 | #296 | Tragic $37,300 |
| Haitians | 0.1 /100 | #297 | Tragic $37,289 |
| Immigrants | Caribbean | 0.1 /100 | #298 | Tragic $37,254 |
| Cherokee | 0.1 /100 | #299 | Tragic $37,203 |
| Immigrants | Bahamas | 0.1 /100 | #300 | Tragic $37,193 |
| Ottawa | 0.1 /100 | #301 | Tragic $37,101 |
| Shoshone | 0.1 /100 | #302 | Tragic $37,072 |
| Paiute | 0.1 /100 | #303 | Tragic $37,066 |
| Hondurans | 0.1 /100 | #304 | Tragic $37,031 |