Nepalese vs Immigrants from Western Europe Householder Income Ages 25 - 44 years
COMPARE
Nepalese
Immigrants from Western Europe
Householder Income Ages 25 - 44 years
Householder Income Ages 25 - 44 years Comparison
Nepalese
Immigrants from Western Europe
$91,498
HOUSEHOLDER INCOME AGES 25 - 44 YEARS
15.4/ 100
METRIC RATING
204th/ 347
METRIC RANK
$102,654
HOUSEHOLDER INCOME AGES 25 - 44 YEARS
98.9/ 100
METRIC RATING
87th/ 347
METRIC RANK
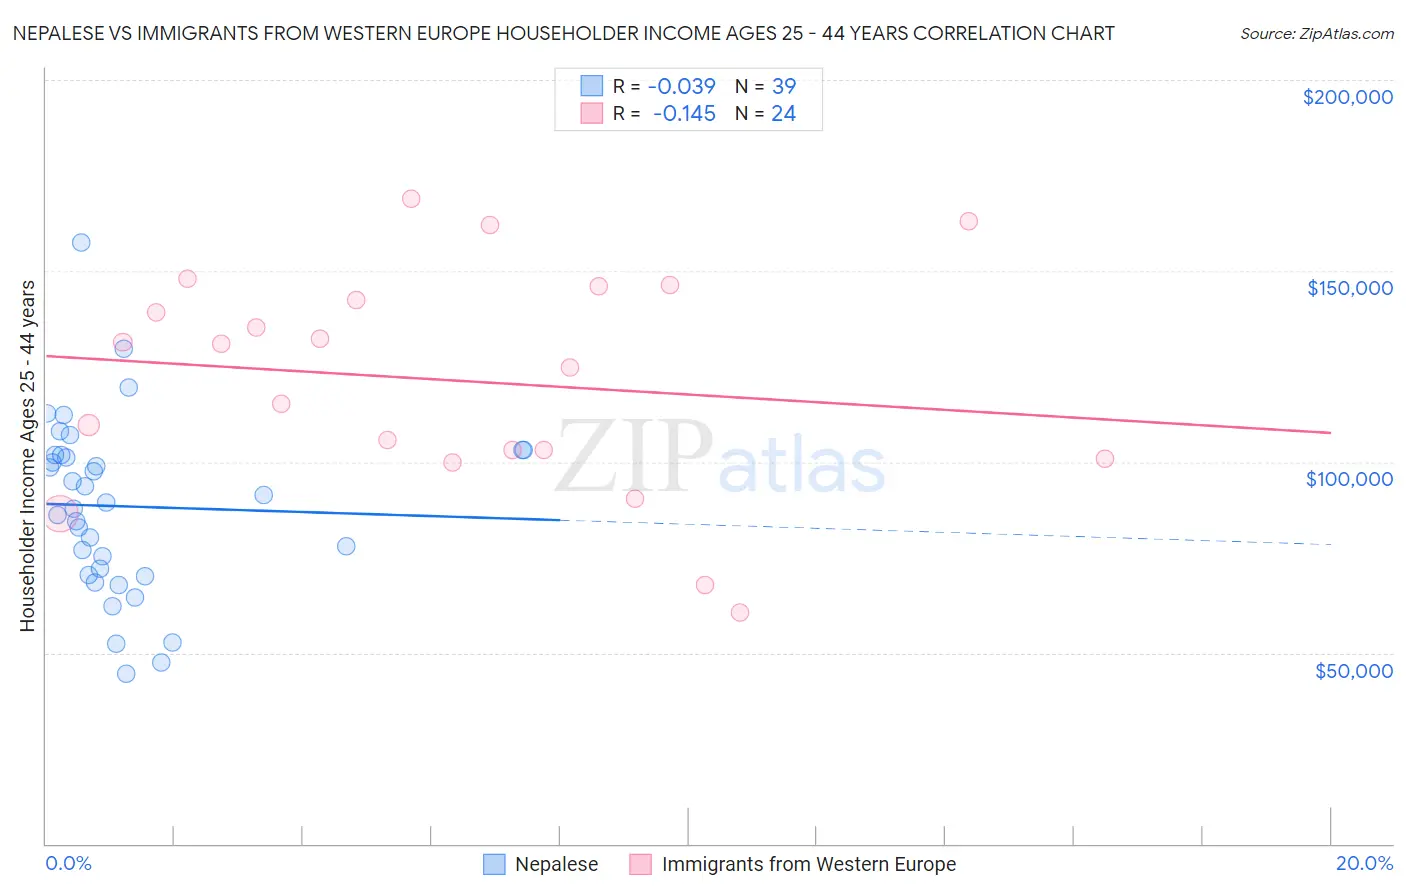
Nepalese vs Immigrants from Western Europe Householder Income Ages 25 - 44 years Correlation Chart
The statistical analysis conducted on geographies consisting of 24,520,458 people shows no correlation between the proportion of Nepalese and household income with householder between the ages 25 and 44 in the United States with a correlation coefficient (R) of -0.039 and weighted average of $91,498. Similarly, the statistical analysis conducted on geographies consisting of 491,977,269 people shows a poor negative correlation between the proportion of Immigrants from Western Europe and household income with householder between the ages 25 and 44 in the United States with a correlation coefficient (R) of -0.145 and weighted average of $102,654, a difference of 12.2%.
Householder Income Ages 25 - 44 years Correlation Summary
| Measurement | Nepalese | Immigrants from Western Europe |
| Minimum | $44,671 | $60,664 |
| Maximum | $157,344 | $169,009 |
| Range | $112,673 | $108,344 |
| Mean | $88,333 | $121,344 |
| Median | $89,253 | $127,790 |
| Interquartile 25% (IQ1) | $70,481 | $101,950 |
| Interquartile 75% (IQ3) | $101,731 | $144,131 |
| Interquartile Range (IQR) | $31,250 | $42,181 |
| Standard Deviation (Sample) | $23,217 | $29,174 |
| Standard Deviation (Population) | $22,917 | $28,560 |
Similar Demographics by Householder Income Ages 25 - 44 years
Demographics Similar to Nepalese by Householder Income Ages 25 - 44 years
In terms of householder income ages 25 - 44 years, the demographic groups most similar to Nepalese are Immigrants from Cambodia ($91,533, a difference of 0.040%), Immigrants from Eastern Africa ($91,458, a difference of 0.040%), Ecuadorian ($91,574, a difference of 0.080%), Japanese ($91,624, a difference of 0.14%), and Aleut ($91,370, a difference of 0.14%).
| Demographics | Rating | Rank | Householder Income Ages 25 - 44 years |
| Spanish | 21.2 /100 | #197 | Fair $92,200 |
| Vietnamese | 20.2 /100 | #198 | Fair $92,089 |
| Kenyans | 16.8 /100 | #199 | Poor $91,684 |
| Whites/Caucasians | 16.7 /100 | #200 | Poor $91,668 |
| Japanese | 16.4 /100 | #201 | Poor $91,624 |
| Ecuadorians | 16.0 /100 | #202 | Poor $91,574 |
| Immigrants | Cambodia | 15.7 /100 | #203 | Poor $91,533 |
| Nepalese | 15.4 /100 | #204 | Poor $91,498 |
| Immigrants | Eastern Africa | 15.2 /100 | #205 | Poor $91,458 |
| Aleuts | 14.5 /100 | #206 | Poor $91,370 |
| Yugoslavians | 14.5 /100 | #207 | Poor $91,368 |
| Immigrants | Thailand | 14.3 /100 | #208 | Poor $91,337 |
| Immigrants | Uruguay | 13.2 /100 | #209 | Poor $91,171 |
| Immigrants | Kenya | 10.9 /100 | #210 | Poor $90,767 |
| Iraqis | 10.8 /100 | #211 | Poor $90,764 |
Demographics Similar to Immigrants from Western Europe by Householder Income Ages 25 - 44 years
In terms of householder income ages 25 - 44 years, the demographic groups most similar to Immigrants from Western Europe are Immigrants from Hungary ($102,655, a difference of 0.0%), Immigrants from Ukraine ($102,664, a difference of 0.010%), Immigrants from Canada ($102,616, a difference of 0.040%), Romanian ($102,544, a difference of 0.11%), and Ukrainian ($102,451, a difference of 0.20%).
| Demographics | Rating | Rank | Householder Income Ages 25 - 44 years |
| Immigrants | Egypt | 99.2 /100 | #80 | Exceptional $103,192 |
| South Africans | 99.2 /100 | #81 | Exceptional $103,160 |
| Immigrants | Serbia | 99.2 /100 | #82 | Exceptional $103,155 |
| Argentineans | 99.1 /100 | #83 | Exceptional $103,111 |
| Immigrants | Philippines | 99.0 /100 | #84 | Exceptional $102,910 |
| Immigrants | Ukraine | 98.9 /100 | #85 | Exceptional $102,664 |
| Immigrants | Hungary | 98.9 /100 | #86 | Exceptional $102,655 |
| Immigrants | Western Europe | 98.9 /100 | #87 | Exceptional $102,654 |
| Immigrants | Canada | 98.9 /100 | #88 | Exceptional $102,616 |
| Romanians | 98.8 /100 | #89 | Exceptional $102,544 |
| Ukrainians | 98.8 /100 | #90 | Exceptional $102,451 |
| Croatians | 98.7 /100 | #91 | Exceptional $102,414 |
| Immigrants | North America | 98.7 /100 | #92 | Exceptional $102,407 |
| Immigrants | England | 98.4 /100 | #93 | Exceptional $102,020 |
| Sri Lankans | 98.4 /100 | #94 | Exceptional $101,960 |