American vs Immigrants from Southern Europe Householder Income Ages 25 - 44 years
COMPARE
American
Immigrants from Southern Europe
Householder Income Ages 25 - 44 years
Householder Income Ages 25 - 44 years Comparison
Americans
Immigrants from Southern Europe
$84,791
HOUSEHOLDER INCOME AGES 25 - 44 YEARS
0.4/ 100
METRIC RATING
260th/ 347
METRIC RANK
$103,486
HOUSEHOLDER INCOME AGES 25 - 44 YEARS
99.3/ 100
METRIC RATING
77th/ 347
METRIC RANK
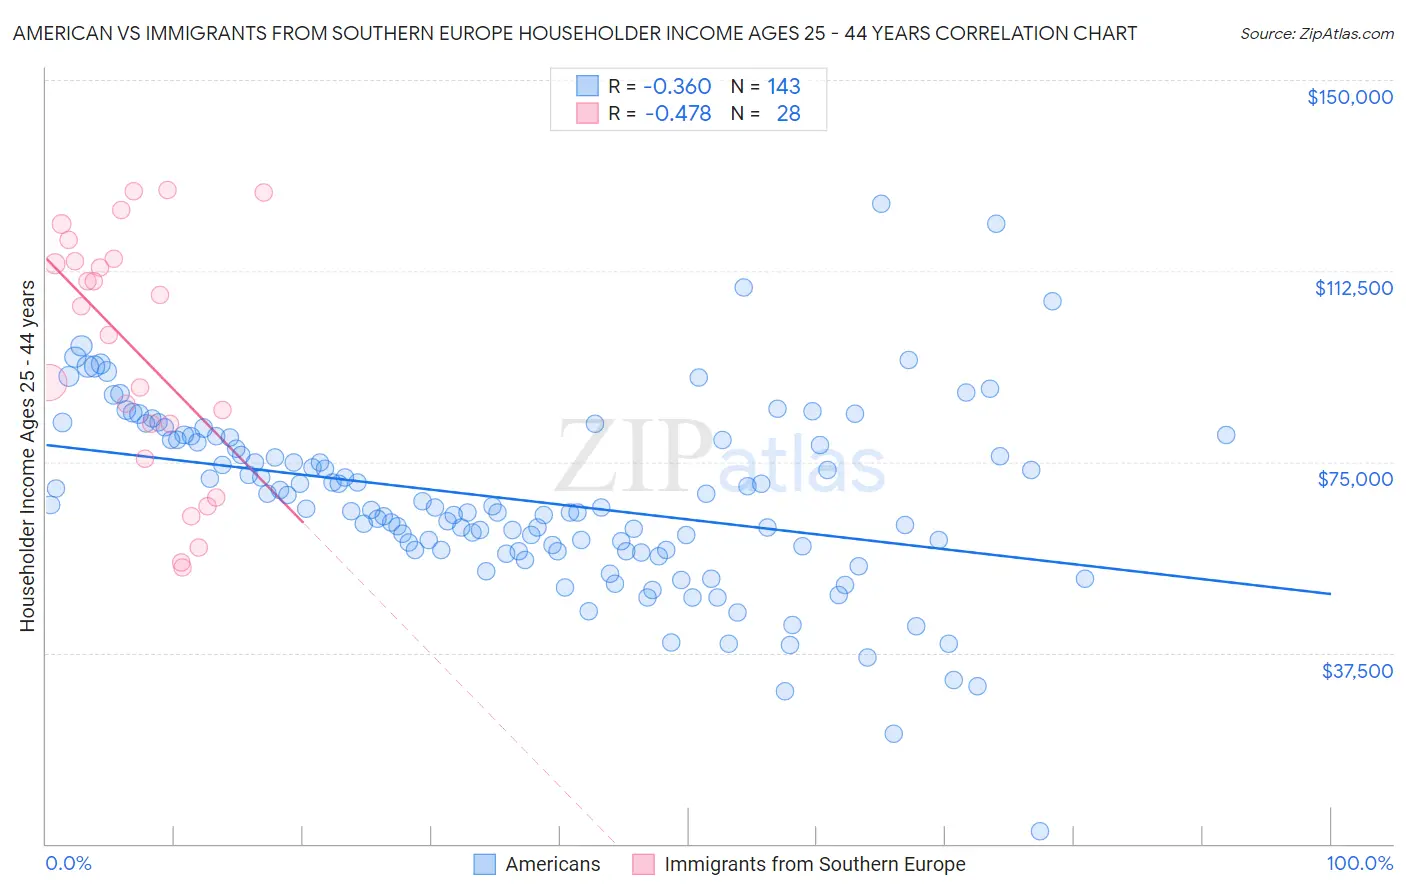
American vs Immigrants from Southern Europe Householder Income Ages 25 - 44 years Correlation Chart
The statistical analysis conducted on geographies consisting of 574,694,718 people shows a mild negative correlation between the proportion of Americans and household income with householder between the ages 25 and 44 in the United States with a correlation coefficient (R) of -0.360 and weighted average of $84,791. Similarly, the statistical analysis conducted on geographies consisting of 401,612,354 people shows a moderate negative correlation between the proportion of Immigrants from Southern Europe and household income with householder between the ages 25 and 44 in the United States with a correlation coefficient (R) of -0.478 and weighted average of $103,486, a difference of 22.1%.
Householder Income Ages 25 - 44 years Correlation Summary
| Measurement | American | Immigrants from Southern Europe |
| Minimum | $2,499 | $54,315 |
| Maximum | $125,750 | $128,289 |
| Range | $123,251 | $73,974 |
| Mean | $67,597 | $96,371 |
| Median | $65,930 | $102,776 |
| Interquartile 25% (IQ1) | $57,596 | $78,949 |
| Interquartile 75% (IQ3) | $79,418 | $114,674 |
| Interquartile Range (IQR) | $21,822 | $35,724 |
| Standard Deviation (Sample) | $18,011 | $24,047 |
| Standard Deviation (Population) | $17,948 | $23,614 |
Similar Demographics by Householder Income Ages 25 - 44 years
Demographics Similar to Americans by Householder Income Ages 25 - 44 years
In terms of householder income ages 25 - 44 years, the demographic groups most similar to Americans are Immigrants from Senegal ($84,848, a difference of 0.070%), Immigrants from Nicaragua ($84,914, a difference of 0.14%), Inupiat ($84,619, a difference of 0.20%), Cree ($84,574, a difference of 0.26%), and Belizean ($84,534, a difference of 0.30%).
| Demographics | Rating | Rank | Householder Income Ages 25 - 44 years |
| British West Indians | 0.7 /100 | #253 | Tragic $85,565 |
| Immigrants | Laos | 0.7 /100 | #254 | Tragic $85,553 |
| German Russians | 0.6 /100 | #255 | Tragic $85,220 |
| Central Americans | 0.5 /100 | #256 | Tragic $85,144 |
| Mexican American Indians | 0.5 /100 | #257 | Tragic $85,066 |
| Immigrants | Nicaragua | 0.5 /100 | #258 | Tragic $84,914 |
| Immigrants | Senegal | 0.5 /100 | #259 | Tragic $84,848 |
| Americans | 0.4 /100 | #260 | Tragic $84,791 |
| Inupiat | 0.4 /100 | #261 | Tragic $84,619 |
| Cree | 0.4 /100 | #262 | Tragic $84,574 |
| Belizeans | 0.4 /100 | #263 | Tragic $84,534 |
| Osage | 0.4 /100 | #264 | Tragic $84,461 |
| Sudanese | 0.4 /100 | #265 | Tragic $84,401 |
| Immigrants | Cabo Verde | 0.3 /100 | #266 | Tragic $84,304 |
| Hmong | 0.3 /100 | #267 | Tragic $84,258 |
Demographics Similar to Immigrants from Southern Europe by Householder Income Ages 25 - 44 years
In terms of householder income ages 25 - 44 years, the demographic groups most similar to Immigrants from Southern Europe are Immigrants from Bulgaria ($103,423, a difference of 0.060%), Armenian ($103,248, a difference of 0.23%), Immigrants from Spain ($103,752, a difference of 0.26%), Immigrants from Egypt ($103,192, a difference of 0.28%), and South African ($103,160, a difference of 0.32%).
| Demographics | Rating | Rank | Householder Income Ages 25 - 44 years |
| Immigrants | Croatia | 99.6 /100 | #70 | Exceptional $104,503 |
| Afghans | 99.6 /100 | #71 | Exceptional $104,410 |
| Chinese | 99.5 /100 | #72 | Exceptional $104,264 |
| Italians | 99.5 /100 | #73 | Exceptional $104,215 |
| Immigrants | Fiji | 99.5 /100 | #74 | Exceptional $103,954 |
| Koreans | 99.4 /100 | #75 | Exceptional $103,824 |
| Immigrants | Spain | 99.4 /100 | #76 | Exceptional $103,752 |
| Immigrants | Southern Europe | 99.3 /100 | #77 | Exceptional $103,486 |
| Immigrants | Bulgaria | 99.3 /100 | #78 | Exceptional $103,423 |
| Armenians | 99.2 /100 | #79 | Exceptional $103,248 |
| Immigrants | Egypt | 99.2 /100 | #80 | Exceptional $103,192 |
| South Africans | 99.2 /100 | #81 | Exceptional $103,160 |
| Immigrants | Serbia | 99.2 /100 | #82 | Exceptional $103,155 |
| Argentineans | 99.1 /100 | #83 | Exceptional $103,111 |
| Immigrants | Philippines | 99.0 /100 | #84 | Exceptional $102,910 |