Dutch vs Immigrants from Southern Europe Householder Income Ages 25 - 44 years

COMPARE

Dutch
Race
Ancestry
AfghanAfricanAlaska NativeAlaskan AthabascanAlbanianAleutAlsatianAmericanApacheArabArapahoArgentineanArmenianAssyrian/Chaldean/SyriacAustralianAustrianBahamianBangladeshiBarbadianBasqueBelgianBelizeanBermudanBhutaneseBlackfeetBolivianBrazilianBritishBritish West IndianBulgarianBurmeseCajunCambodianCanadianCape VerdeanCarpatho RusynCelticCentral AmericanCentral American IndianCherokeeCheyenneChickasawChileanChineseChippewaChoctawColombianColvilleComancheCosta RicanCreeCreekCroatianCrowCubanCypriotCzechCzechoslovakianDanishDelawareDominicanDutchDutch West IndianEastern EuropeanEcuadorianEgyptianEnglishEstonianEthiopianEuropeanFijianFilipinoFinnishFrenchFrench American IndianFrench CanadianGermanGerman RussianGhanaianGreekGuamanian/ChamorroGuatemalanGuyaneseHaitianHmongHonduranHopiHoumaHungarianIcelanderIndian (Asian)IndonesianInupiatIranianIraqiIrishIroquoisIsraeliItalianJamaicanJapaneseJordanianKenyanKiowaKoreanLaotianLatvianLebaneseLiberianLithuanianLumbeeLuxembourgerMacedonianMalaysianMalteseMarshalleseMenomineeMexicanMexican American IndianMongolianMoroccanNative HawaiianNavajoNepaleseNew ZealanderNicaraguanNigerianNorthern EuropeanNorwegianOkinawanOsageOttawaPaiutePakistaniPalestinianPanamanianParaguayanPennsylvania GermanPeruvianPimaPolishPortuguesePotawatomiPuebloPuerto RicanPuget Sound SalishRomanianRussianSalvadoranSamoanScandinavianScotch-IrishScottishSeminoleSenegaleseSerbianShoshoneSierra LeoneanSiouxSlavicSlovakSloveneSomaliSouth AfricanSouth AmericanSouth American IndianSoviet UnionSpaniardSpanishSpanish AmericanSpanish American IndianSri LankanSubsaharan AfricanSudaneseSwedishSwissSyrianTaiwaneseThaiTlingit-HaidaTohono O'OdhamTonganTrinidadian and TobagonianTsimshianTurkishU.S. Virgin IslanderUgandanUkrainianUruguayanUteVenezuelanVietnameseWelshWest IndianYakamaYaquiYugoslavianYumanYup'ikZimbabwean
Immigration
NonimmigrantsImmigrantsAfghanistanAfricaAlbaniaArgentinaArmeniaAsiaAustraliaAustriaBahamasBangladeshBarbadosBelarusBelgiumBelizeBoliviaBosnia and HerzegovinaBrazilBulgariaBurma/MyanmarCabo VerdeCambodiaCameroonCanadaCaribbeanCentral AmericaChileChinaColombiaCongoCosta RicaCroatiaCubaCzechoslovakiaDenmarkDominicaDominican RepublicEastern AfricaEastern AsiaEastern EuropeEcuadorEgyptEl SalvadorEnglandEritreaEthiopiaEuropeFijiFranceGermanyGhanaGreeceGrenadaGuatemalaGuyanaHaitiHondurasHong KongHungaryIndiaIndonesiaIranIraqIrelandIsraelItalyJamaicaJapanJordanKazakhstanKenyaKoreaKuwaitLaosLatin AmericaLatviaLebanonLiberiaLithuaniaMalaysiaMexicoMicronesiaMiddle AfricaMoldovaMoroccoNepalNetherlandsNicaraguaNigeriaNorth AmericaNorth MacedoniaNorthern AfricaNorthern EuropeNorwayOceaniaPakistanPanamaPeruPhilippinesPolandPortugalRomaniaRussiaSaudi ArabiaScotlandSenegalSerbiaSierra LeoneSingaporeSomaliaSouth AfricaSouth AmericaSouth Central AsiaSouth Eastern AsiaSpainSri LankaSt. Vincent and the GrenadinesSudanSwedenSwitzerlandSyriaTaiwanThailandTrinidad and TobagoTurkeyUgandaUkraineUruguayUzbekistanVenezuelaVietnamWest IndiesWestern AfricaWestern AsiaWestern EuropeYemenZaireZimbabweAzores
Immigrants from Southern Europe
Race
Ancestry
AfghanAfricanAlaska NativeAlaskan AthabascanAlbanianAleutAlsatianAmericanApacheArabArapahoArgentineanArmenianAssyrian/Chaldean/SyriacAustralianAustrianBahamianBangladeshiBarbadianBasqueBelgianBelizeanBermudanBhutaneseBlackfeetBolivianBrazilianBritishBritish West IndianBulgarianBurmeseCajunCambodianCanadianCape VerdeanCarpatho RusynCelticCentral AmericanCentral American IndianCherokeeCheyenneChickasawChileanChineseChippewaChoctawColombianColvilleComancheCosta RicanCreeCreekCroatianCrowCubanCypriotCzechCzechoslovakianDanishDelawareDominicanDutch West IndianEastern EuropeanEcuadorianEgyptianEnglishEstonianEthiopianEuropeanFijianFilipinoFinnishFrenchFrench American IndianFrench CanadianGermanGerman RussianGhanaianGreekGuamanian/ChamorroGuatemalanGuyaneseHaitianHmongHonduranHopiHoumaHungarianIcelanderIndian (Asian)IndonesianInupiatIranianIraqiIrishIroquoisIsraeliItalianJamaicanJapaneseJordanianKenyanKiowaKoreanLaotianLatvianLebaneseLiberianLithuanianLumbeeLuxembourgerMacedonianMalaysianMalteseMarshalleseMenomineeMexicanMexican American IndianMongolianMoroccanNative HawaiianNavajoNepaleseNew ZealanderNicaraguanNigerianNorthern EuropeanNorwegianOkinawanOsageOttawaPaiutePakistaniPalestinianPanamanianParaguayanPennsylvania GermanPeruvianPimaPolishPortuguesePotawatomiPuebloPuerto RicanPuget Sound SalishRomanianRussianSalvadoranSamoanScandinavianScotch-IrishScottishSeminoleSenegaleseSerbianShoshoneSierra LeoneanSiouxSlavicSlovakSloveneSomaliSouth AfricanSouth AmericanSouth American IndianSoviet UnionSpaniardSpanishSpanish AmericanSpanish American IndianSri LankanSubsaharan AfricanSudaneseSwedishSwissSyrianTaiwaneseThaiTlingit-HaidaTohono O'OdhamTonganTrinidadian and TobagonianTsimshianTurkishU.S. Virgin IslanderUgandanUkrainianUruguayanUteVenezuelanVietnameseWelshWest IndianYakamaYaquiYugoslavianYumanYup'ikZimbabwean
Immigration
NonimmigrantsImmigrantsAfghanistanAfricaAlbaniaArgentinaArmeniaAsiaAustraliaAustriaBahamasBangladeshBarbadosBelarusBelgiumBelizeBoliviaBosnia and HerzegovinaBrazilBulgariaBurma/MyanmarCabo VerdeCambodiaCameroonCanadaCaribbeanCentral AmericaChileChinaColombiaCongoCosta RicaCroatiaCubaCzechoslovakiaDenmarkDominicaDominican RepublicEastern AfricaEastern AsiaEastern EuropeEcuadorEgyptEl SalvadorEnglandEritreaEthiopiaEuropeFijiFranceGermanyGhanaGreeceGrenadaGuatemalaGuyanaHaitiHondurasHong KongHungaryIndiaIndonesiaIranIraqIrelandIsraelItalyJamaicaJapanJordanKazakhstanKenyaKoreaKuwaitLaosLatin AmericaLatviaLebanonLiberiaLithuaniaMalaysiaMexicoMicronesiaMiddle AfricaMoldovaMoroccoNepalNetherlandsNicaraguaNigeriaNorth AmericaNorth MacedoniaNorthern AfricaNorthern EuropeNorwayOceaniaPakistanPanamaPeruPhilippinesPolandPortugalRomaniaRussiaSaudi ArabiaScotlandSenegalSerbiaSierra LeoneSingaporeSomaliaSouth AfricaSouth AmericaSouth Central AsiaSouth Eastern AsiaSouthern EuropeSpainSri LankaSt. Vincent and the GrenadinesSudanSwedenSwitzerlandSyriaTaiwanThailandTrinidad and TobagoTurkeyUgandaUkraineUruguayUzbekistanVenezuelaVietnamWest IndiesWestern AfricaWestern AsiaWestern EuropeYemenZaireZimbabweAzores
Householder Income Ages 25 - 44 years
Income
Poverty
Unemployment
Labor Participation
Family Structure
Vehicle Availability
Education Level
Disability

Householder Income Ages 25 - 44 years Comparison

Dutch

Immigrants from Southern Europe

Fair
Exceptional
$93,081
HOUSEHOLDER INCOME AGES 25 - 44 YEARS
30.5/ 100
METRIC RATING
189th/ 347
METRIC RANK
$103,486
HOUSEHOLDER INCOME AGES 25 - 44 YEARS
99.3/ 100
METRIC RATING
77th/ 347
METRIC RANK

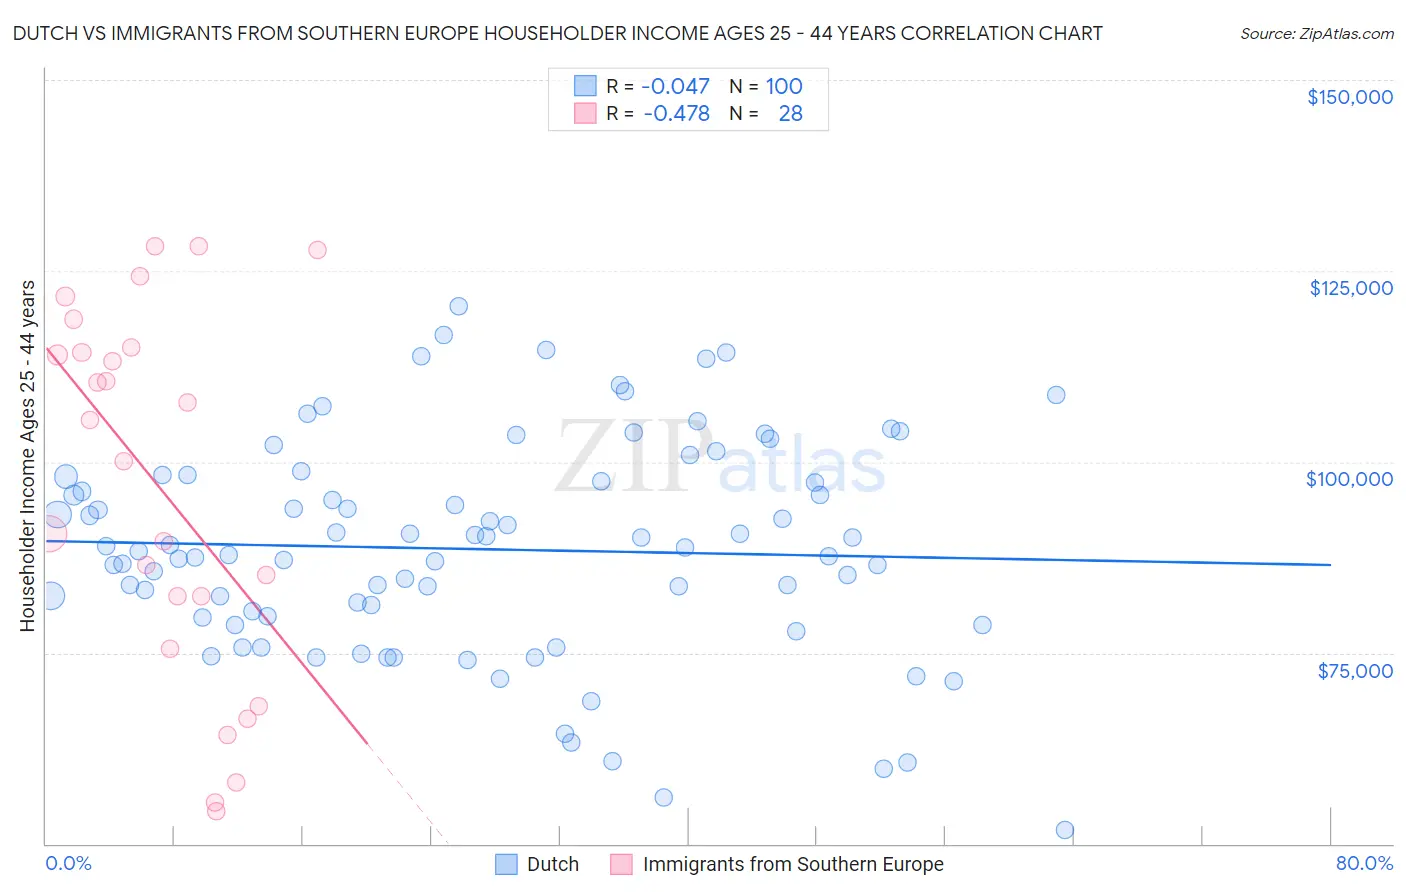
Dutch vs Immigrants from Southern Europe Householder Income Ages 25 - 44 years Correlation Chart

The statistical analysis conducted on geographies consisting of 549,678,826 people shows no correlation between the proportion of Dutch and household income with householder between the ages 25 and 44 in the United States with a correlation coefficient (R) of -0.047 and weighted average of $93,081. Similarly, the statistical analysis conducted on geographies consisting of 401,612,354 people shows a moderate negative correlation between the proportion of Immigrants from Southern Europe and household income with householder between the ages 25 and 44 in the United States with a correlation coefficient (R) of -0.478 and weighted average of $103,486, a difference of 11.2%.
Dutch vs Immigrants from Southern Europe Householder Income Ages 25 - 44 years

Householder Income Ages 25 - 44 years Correlation Summary

MeasurementDutchImmigrants from Southern Europe
Minimum$51,827$54,315
Maximum$120,421$128,289
Range$68,594$73,974
Mean$88,577$96,371
Median$88,539$102,776
Interquartile 25% (IQ1)$79,727$78,949
Interquartile 75% (IQ3)$97,721$114,674
Interquartile Range (IQR)$17,995$35,724
Standard Deviation (Sample)$14,058$24,047
Standard Deviation (Population)$13,987$23,614

Similar Demographics by Householder Income Ages 25 - 44 years

Demographics Similar to Dutch by Householder Income Ages 25 - 44 years

In terms of householder income ages 25 - 44 years, the demographic groups most similar to Dutch are Immigrants from Sierra Leone ($93,115, a difference of 0.040%), Welsh ($93,039, a difference of 0.040%), Tlingit-Haida ($92,987, a difference of 0.10%), Immigrants from Costa Rica ($92,876, a difference of 0.22%), and Spaniard ($93,366, a difference of 0.31%).
DemographicsRating | RankHouseholder Income Ages 25 - 44 years
Uruguayans
37.3
/100
|
#182
Fair
$93,631
Guamanians/Chamorros
36.5
/100
|
#183
Fair
$93,569
Germans
36.0
/100
|
#184
Fair
$93,531
Immigrants | Eritrea
35.2
/100
|
#185
Fair
$93,466
Sierra Leoneans
34.8
/100
|
#186
Fair
$93,435
Spaniards
34.0
/100
|
#187
Fair
$93,366
Immigrants | Sierra Leone
30.9
/100
|
#188
Fair
$93,115
Dutch
30.5
/100
|
#189
Fair
$93,081
Welsh
30.0
/100
|
#190
Fair
$93,039
Tlingit-Haida
29.4
/100
|
#191
Fair
$92,987
Immigrants | Costa Rica
28.2
/100
|
#192
Fair
$92,876
Samoans
23.0
/100
|
#193
Fair
$92,385
Immigrants | Azores
22.4
/100
|
#194
Fair
$92,322
Celtics
21.6
/100
|
#195
Fair
$92,241
Immigrants | Colombia
21.3
/100
|
#196
Fair
$92,204

Demographics Similar to Immigrants from Southern Europe by Householder Income Ages 25 - 44 years

In terms of householder income ages 25 - 44 years, the demographic groups most similar to Immigrants from Southern Europe are Immigrants from Bulgaria ($103,423, a difference of 0.060%), Armenian ($103,248, a difference of 0.23%), Immigrants from Spain ($103,752, a difference of 0.26%), Immigrants from Egypt ($103,192, a difference of 0.28%), and South African ($103,160, a difference of 0.32%).
DemographicsRating | RankHouseholder Income Ages 25 - 44 years
Immigrants | Croatia
99.6
/100
|
#70
Exceptional
$104,503
Afghans
99.6
/100
|
#71
Exceptional
$104,410
Chinese
99.5
/100
|
#72
Exceptional
$104,264
Italians
99.5
/100
|
#73
Exceptional
$104,215
Immigrants | Fiji
99.5
/100
|
#74
Exceptional
$103,954
Koreans
99.4
/100
|
#75
Exceptional
$103,824
Immigrants | Spain
99.4
/100
|
#76
Exceptional
$103,752
Immigrants | Southern Europe
99.3
/100
|
#77
Exceptional
$103,486
Immigrants | Bulgaria
99.3
/100
|
#78
Exceptional
$103,423
Armenians
99.2
/100
|
#79
Exceptional
$103,248
Immigrants | Egypt
99.2
/100
|
#80
Exceptional
$103,192
South Africans
99.2
/100
|
#81
Exceptional
$103,160
Immigrants | Serbia
99.2
/100
|
#82
Exceptional
$103,155
Argentineans
99.1
/100
|
#83
Exceptional
$103,111
Immigrants | Philippines
99.0
/100
|
#84
Exceptional
$102,910