Alaskan Athabascan vs Apache Child Poverty Under the Age of 16

COMPARE

Alaskan Athabascan
Race
Ancestry
AfghanAfricanAlaska NativeAlaskan AthabascanAlbanianAleutAlsatianAmericanArabArapahoArgentineanArmenianAssyrian/Chaldean/SyriacAustralianAustrianBahamianBangladeshiBarbadianBasqueBelgianBelizeanBermudanBhutaneseBlackfeetBolivianBrazilianBritishBritish West IndianBulgarianBurmeseCajunCambodianCanadianCape VerdeanCarpatho RusynCelticCentral AmericanCentral American IndianCherokeeCheyenneChickasawChileanChineseChippewaChoctawColombianColvilleComancheCosta RicanCreeCreekCroatianCrowCubanCypriotCzechCzechoslovakianDanishDelawareDominicanDutchDutch West IndianEastern EuropeanEcuadorianEgyptianEnglishEstonianEthiopianEuropeanFijianFilipinoFinnishFrenchFrench American IndianFrench CanadianGermanGerman RussianGhanaianGreekGuamanian/ChamorroGuatemalanGuyaneseHaitianHmongHonduranHopiHoumaHungarianIcelanderIndian (Asian)IndonesianInupiatIranianIraqiIrishIroquoisIsraeliItalianJamaicanJapaneseJordanianKenyanKiowaKoreanLaotianLatvianLebaneseLiberianLithuanianLumbeeLuxembourgerMacedonianMalaysianMalteseMarshalleseMenomineeMexicanMexican American IndianMongolianMoroccanNative HawaiianNavajoNepaleseNew ZealanderNicaraguanNigerianNorthern EuropeanNorwegianOkinawanOsageOttawaPaiutePakistaniPalestinianPanamanianParaguayanPennsylvania GermanPeruvianPimaPolishPortuguesePotawatomiPuebloPuerto RicanPuget Sound SalishRomanianRussianSalvadoranSamoanScandinavianScotch-IrishScottishSeminoleSenegaleseSerbianShoshoneSierra LeoneanSiouxSlavicSlovakSloveneSomaliSouth AfricanSouth AmericanSouth American IndianSoviet UnionSpaniardSpanishSpanish AmericanSpanish American IndianSri LankanSubsaharan AfricanSudaneseSwedishSwissSyrianTaiwaneseThaiTlingit-HaidaTohono O'OdhamTonganTrinidadian and TobagonianTsimshianTurkishU.S. Virgin IslanderUgandanUkrainianUruguayanUteVenezuelanVietnameseWelshWest IndianYakamaYaquiYugoslavianYumanYup'ikZimbabwean
Immigration
NonimmigrantsImmigrantsAfghanistanAfricaAlbaniaArgentinaArmeniaAsiaAustraliaAustriaBahamasBangladeshBarbadosBelarusBelgiumBelizeBoliviaBosnia and HerzegovinaBrazilBulgariaBurma/MyanmarCabo VerdeCambodiaCameroonCanadaCaribbeanCentral AmericaChileChinaColombiaCongoCosta RicaCroatiaCubaCzechoslovakiaDenmarkDominicaDominican RepublicEastern AfricaEastern AsiaEastern EuropeEcuadorEgyptEl SalvadorEnglandEritreaEthiopiaEuropeFijiFranceGermanyGhanaGreeceGrenadaGuatemalaGuyanaHaitiHondurasHong KongHungaryIndiaIndonesiaIranIraqIrelandIsraelItalyJamaicaJapanJordanKazakhstanKenyaKoreaKuwaitLaosLatin AmericaLatviaLebanonLiberiaLithuaniaMalaysiaMexicoMicronesiaMiddle AfricaMoldovaMoroccoNepalNetherlandsNicaraguaNigeriaNorth AmericaNorth MacedoniaNorthern AfricaNorthern EuropeNorwayOceaniaPakistanPanamaPeruPhilippinesPolandPortugalRomaniaRussiaSaudi ArabiaScotlandSenegalSerbiaSierra LeoneSingaporeSomaliaSouth AfricaSouth AmericaSouth Central AsiaSouth Eastern AsiaSouthern EuropeSpainSri LankaSt. Vincent and the GrenadinesSudanSwedenSwitzerlandSyriaTaiwanThailandTrinidad and TobagoTurkeyUgandaUkraineUruguayUzbekistanVenezuelaVietnamWest IndiesWestern AfricaWestern AsiaWestern EuropeYemenZaireZimbabweAzores
Apache
Race
Ancestry
AfghanAfricanAlaska NativeAlbanianAleutAlsatianAmericanApacheArabArapahoArgentineanArmenianAssyrian/Chaldean/SyriacAustralianAustrianBahamianBangladeshiBarbadianBasqueBelgianBelizeanBermudanBhutaneseBlackfeetBolivianBrazilianBritishBritish West IndianBulgarianBurmeseCajunCambodianCanadianCape VerdeanCarpatho RusynCelticCentral AmericanCentral American IndianCherokeeCheyenneChickasawChileanChineseChippewaChoctawColombianColvilleComancheCosta RicanCreeCreekCroatianCrowCubanCypriotCzechCzechoslovakianDanishDelawareDominicanDutchDutch West IndianEastern EuropeanEcuadorianEgyptianEnglishEstonianEthiopianEuropeanFijianFilipinoFinnishFrenchFrench American IndianFrench CanadianGermanGerman RussianGhanaianGreekGuamanian/ChamorroGuatemalanGuyaneseHaitianHmongHonduranHopiHoumaHungarianIcelanderIndian (Asian)IndonesianInupiatIranianIraqiIrishIroquoisIsraeliItalianJamaicanJapaneseJordanianKenyanKiowaKoreanLaotianLatvianLebaneseLiberianLithuanianLumbeeLuxembourgerMacedonianMalaysianMalteseMarshalleseMenomineeMexicanMexican American IndianMongolianMoroccanNative HawaiianNavajoNepaleseNew ZealanderNicaraguanNigerianNorthern EuropeanNorwegianOkinawanOsageOttawaPaiutePakistaniPalestinianPanamanianParaguayanPennsylvania GermanPeruvianPimaPolishPortuguesePotawatomiPuebloPuerto RicanPuget Sound SalishRomanianRussianSalvadoranSamoanScandinavianScotch-IrishScottishSeminoleSenegaleseSerbianShoshoneSierra LeoneanSiouxSlavicSlovakSloveneSomaliSouth AfricanSouth AmericanSouth American IndianSoviet UnionSpaniardSpanishSpanish AmericanSpanish American IndianSri LankanSubsaharan AfricanSudaneseSwedishSwissSyrianTaiwaneseThaiTlingit-HaidaTohono O'OdhamTonganTrinidadian and TobagonianTsimshianTurkishU.S. Virgin IslanderUgandanUkrainianUruguayanUteVenezuelanVietnameseWelshWest IndianYakamaYaquiYugoslavianYumanYup'ikZimbabwean
Immigration
NonimmigrantsImmigrantsAfghanistanAfricaAlbaniaArgentinaArmeniaAsiaAustraliaAustriaBahamasBangladeshBarbadosBelarusBelgiumBelizeBoliviaBosnia and HerzegovinaBrazilBulgariaBurma/MyanmarCabo VerdeCambodiaCameroonCanadaCaribbeanCentral AmericaChileChinaColombiaCongoCosta RicaCroatiaCubaCzechoslovakiaDenmarkDominicaDominican RepublicEastern AfricaEastern AsiaEastern EuropeEcuadorEgyptEl SalvadorEnglandEritreaEthiopiaEuropeFijiFranceGermanyGhanaGreeceGrenadaGuatemalaGuyanaHaitiHondurasHong KongHungaryIndiaIndonesiaIranIraqIrelandIsraelItalyJamaicaJapanJordanKazakhstanKenyaKoreaKuwaitLaosLatin AmericaLatviaLebanonLiberiaLithuaniaMalaysiaMexicoMicronesiaMiddle AfricaMoldovaMoroccoNepalNetherlandsNicaraguaNigeriaNorth AmericaNorth MacedoniaNorthern AfricaNorthern EuropeNorwayOceaniaPakistanPanamaPeruPhilippinesPolandPortugalRomaniaRussiaSaudi ArabiaScotlandSenegalSerbiaSierra LeoneSingaporeSomaliaSouth AfricaSouth AmericaSouth Central AsiaSouth Eastern AsiaSouthern EuropeSpainSri LankaSt. Vincent and the GrenadinesSudanSwedenSwitzerlandSyriaTaiwanThailandTrinidad and TobagoTurkeyUgandaUkraineUruguayUzbekistanVenezuelaVietnamWest IndiesWestern AfricaWestern AsiaWestern EuropeYemenZaireZimbabweAzores
Child Poverty Under the Age of 16
Income
Poverty
Unemployment
Labor Participation
Family Structure
Vehicle Availability
Education Level
Disability

Child Poverty Under the Age of 16 Comparison

Alaskan Athabascans

Apache

Tragic
Tragic
17.5%
CHILD POVERTY UNDER THE AGE OF 16
6.9/ 100
METRIC RATING
210th/ 347
METRIC RANK
23.8%
CHILD POVERTY UNDER THE AGE OF 16
0.0/ 100
METRIC RATING
331st/ 347
METRIC RANK

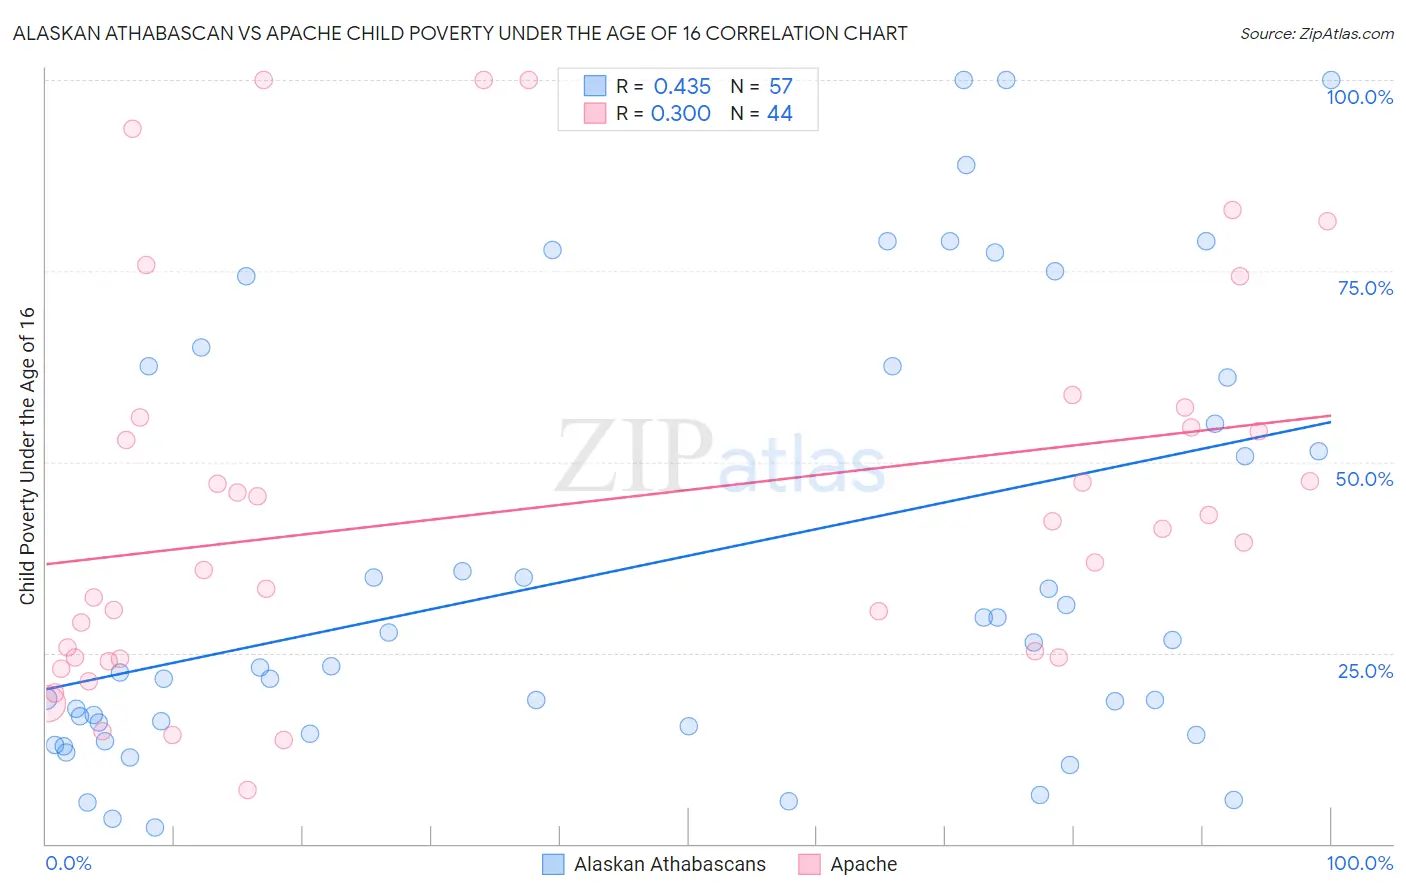
Alaskan Athabascan vs Apache Child Poverty Under the Age of 16 Correlation Chart

The statistical analysis conducted on geographies consisting of 45,725,386 people shows a moderate positive correlation between the proportion of Alaskan Athabascans and poverty level among children under the age of 16 in the United States with a correlation coefficient (R) of 0.435 and weighted average of 17.5%. Similarly, the statistical analysis conducted on geographies consisting of 230,480,863 people shows a weak positive correlation between the proportion of Apache and poverty level among children under the age of 16 in the United States with a correlation coefficient (R) of 0.300 and weighted average of 23.8%, a difference of 36.5%.
Alaskan Athabascan vs Apache Child Poverty Under the Age of 16

Child Poverty Under the Age of 16 Correlation Summary

MeasurementAlaskan AthabascanApache
Minimum2.1%7.0%
Maximum100.0%100.0%
Range97.9%93.0%
Mean36.2%44.3%
Median23.2%40.4%
Interquartile 25% (IQ1)14.9%24.3%
Interquartile 75% (IQ3)61.8%55.2%
Interquartile Range (IQR)46.9%30.9%
Standard Deviation (Sample)28.6%25.1%
Standard Deviation (Population)28.3%24.8%

Similar Demographics by Child Poverty Under the Age of 16

Demographics Similar to Alaskan Athabascans by Child Poverty Under the Age of 16

In terms of child poverty under the age of 16, the demographic groups most similar to Alaskan Athabascans are Panamanian (17.5%, a difference of 0.010%), Immigrants from Thailand (17.5%, a difference of 0.12%), Immigrants (17.5%, a difference of 0.15%), Pennsylvania German (17.4%, a difference of 0.27%), and Immigrants from the Azores (17.5%, a difference of 0.32%).
DemographicsRating | RankChild Poverty Under the Age of 16
Immigrants | Sierra Leone
14.2
/100
|
#203
Poor
17.1%
Hmong
14.0
/100
|
#204
Poor
17.1%
Aleuts
13.9
/100
|
#205
Poor
17.1%
Alaska Natives
11.8
/100
|
#206
Poor
17.2%
German Russians
8.6
/100
|
#207
Tragic
17.4%
Pennsylvania Germans
7.5
/100
|
#208
Tragic
17.4%
Panamanians
6.9
/100
|
#209
Tragic
17.5%
Alaskan Athabascans
6.9
/100
|
#210
Tragic
17.5%
Immigrants | Thailand
6.6
/100
|
#211
Tragic
17.5%
Immigrants | Immigrants
6.5
/100
|
#212
Tragic
17.5%
Immigrants | Azores
6.2
/100
|
#213
Tragic
17.5%
Iraqis
5.9
/100
|
#214
Tragic
17.5%
Malaysians
5.9
/100
|
#215
Tragic
17.5%
Sierra Leoneans
5.7
/100
|
#216
Tragic
17.6%
Immigrants | Eastern Africa
5.3
/100
|
#217
Tragic
17.6%

Demographics Similar to Apache by Child Poverty Under the Age of 16

In terms of child poverty under the age of 16, the demographic groups most similar to Apache are Native/Alaskan (23.8%, a difference of 0.22%), Dominican (23.8%, a difference of 0.31%), Pueblo (23.9%, a difference of 0.38%), Immigrants from Dominican Republic (24.0%, a difference of 0.55%), and Black/African American (24.4%, a difference of 2.5%).
DemographicsRating | RankChild Poverty Under the Age of 16
Central American Indians
0.0
/100
|
#324
Tragic
22.5%
Immigrants | Congo
0.0
/100
|
#325
Tragic
22.5%
Immigrants | Honduras
0.0
/100
|
#326
Tragic
22.7%
Menominee
0.0
/100
|
#327
Tragic
23.0%
Colville
0.0
/100
|
#328
Tragic
23.0%
Dominicans
0.0
/100
|
#329
Tragic
23.8%
Natives/Alaskans
0.0
/100
|
#330
Tragic
23.8%
Apache
0.0
/100
|
#331
Tragic
23.8%
Pueblo
0.0
/100
|
#332
Tragic
23.9%
Immigrants | Dominican Republic
0.0
/100
|
#333
Tragic
24.0%
Blacks/African Americans
0.0
/100
|
#334
Tragic
24.4%
Houma
0.0
/100
|
#335
Tragic
24.9%
Yup'ik
0.0
/100
|
#336
Tragic
25.1%
Sioux
0.0
/100
|
#337
Tragic
25.2%
Cheyenne
0.0
/100
|
#338
Tragic
25.4%