Immigrants from South Eastern Asia vs Immigrants from Eritrea Householder Income Ages 25 - 44 years
COMPARE
Immigrants from South Eastern Asia
Immigrants from Eritrea
Householder Income Ages 25 - 44 years
Householder Income Ages 25 - 44 years Comparison
Immigrants from South Eastern Asia
Immigrants from Eritrea
$100,283
HOUSEHOLDER INCOME AGES 25 - 44 YEARS
96.0/ 100
METRIC RATING
108th/ 347
METRIC RANK
$93,466
HOUSEHOLDER INCOME AGES 25 - 44 YEARS
35.2/ 100
METRIC RATING
185th/ 347
METRIC RANK
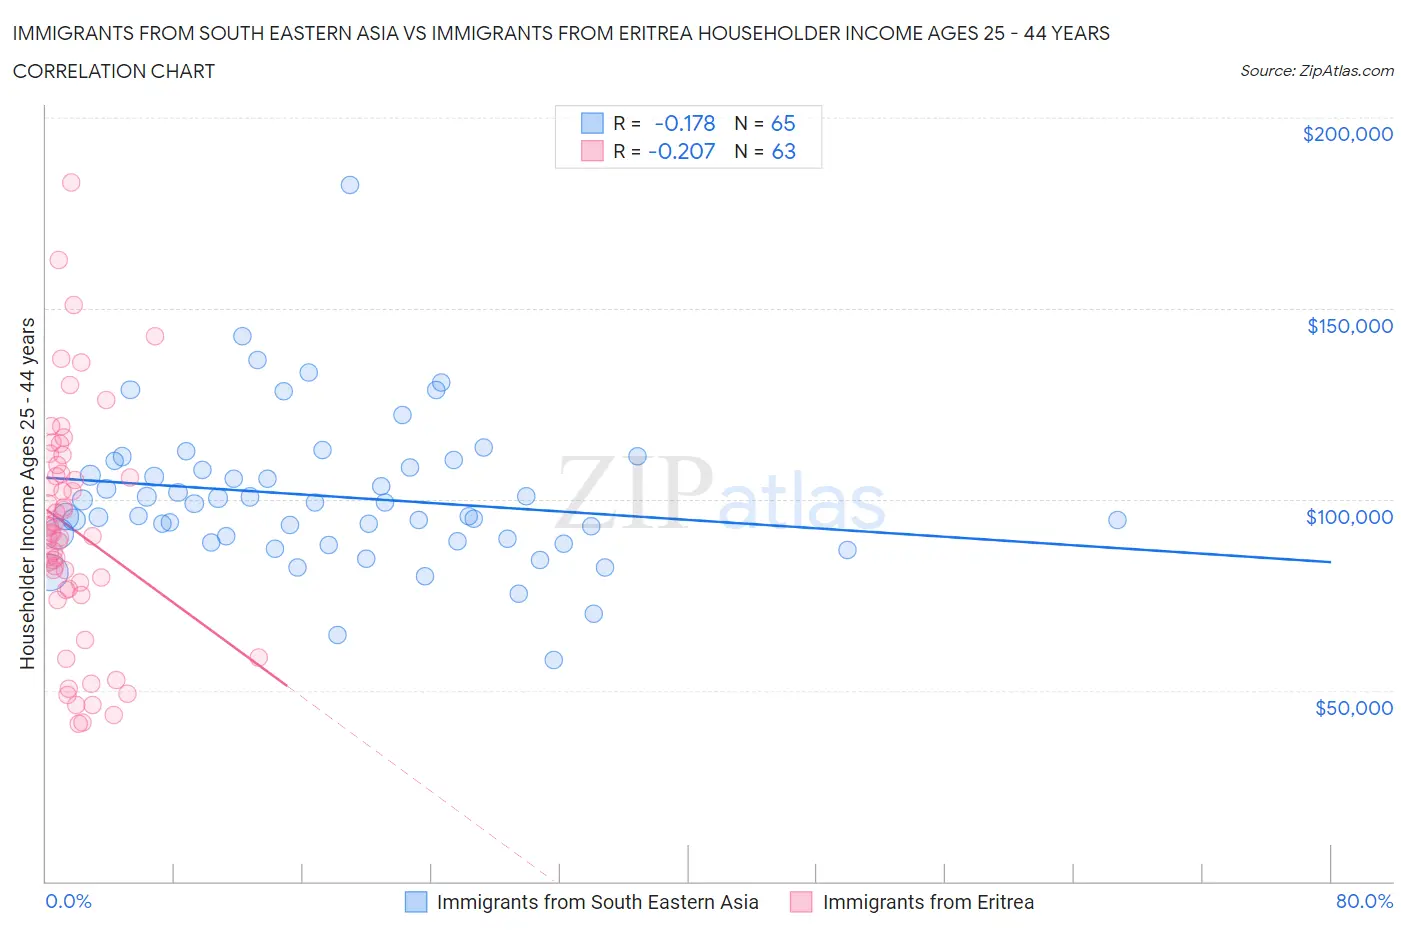
Immigrants from South Eastern Asia vs Immigrants from Eritrea Householder Income Ages 25 - 44 years Correlation Chart
The statistical analysis conducted on geographies consisting of 510,148,738 people shows a poor negative correlation between the proportion of Immigrants from South Eastern Asia and household income with householder between the ages 25 and 44 in the United States with a correlation coefficient (R) of -0.178 and weighted average of $100,283. Similarly, the statistical analysis conducted on geographies consisting of 104,828,872 people shows a weak negative correlation between the proportion of Immigrants from Eritrea and household income with householder between the ages 25 and 44 in the United States with a correlation coefficient (R) of -0.207 and weighted average of $93,466, a difference of 7.3%.
Householder Income Ages 25 - 44 years Correlation Summary
| Measurement | Immigrants from South Eastern Asia | Immigrants from Eritrea |
| Minimum | $57,917 | $41,395 |
| Maximum | $182,472 | $183,112 |
| Range | $124,555 | $141,717 |
| Mean | $100,791 | $92,198 |
| Median | $98,946 | $91,003 |
| Interquartile 25% (IQ1) | $89,392 | $76,431 |
| Interquartile 75% (IQ3) | $109,276 | $109,130 |
| Interquartile Range (IQR) | $19,885 | $32,699 |
| Standard Deviation (Sample) | $19,414 | $30,253 |
| Standard Deviation (Population) | $19,264 | $30,012 |
Similar Demographics by Householder Income Ages 25 - 44 years
Demographics Similar to Immigrants from South Eastern Asia by Householder Income Ages 25 - 44 years
In terms of householder income ages 25 - 44 years, the demographic groups most similar to Immigrants from South Eastern Asia are Northern European ($100,457, a difference of 0.17%), Immigrants from North Macedonia ($100,101, a difference of 0.18%), Immigrants from Vietnam ($100,535, a difference of 0.25%), Immigrants from Brazil ($100,534, a difference of 0.25%), and Immigrants from Afghanistan ($99,977, a difference of 0.31%).
| Demographics | Rating | Rank | Householder Income Ages 25 - 44 years |
| Albanians | 97.8 /100 | #101 | Exceptional $101,367 |
| Immigrants | Lebanon | 97.4 /100 | #102 | Exceptional $101,124 |
| Immigrants | Moldova | 97.4 /100 | #103 | Exceptional $101,091 |
| Immigrants | Poland | 97.4 /100 | #104 | Exceptional $101,065 |
| Immigrants | Vietnam | 96.5 /100 | #105 | Exceptional $100,535 |
| Immigrants | Brazil | 96.5 /100 | #106 | Exceptional $100,534 |
| Northern Europeans | 96.3 /100 | #107 | Exceptional $100,457 |
| Immigrants | South Eastern Asia | 96.0 /100 | #108 | Exceptional $100,283 |
| Immigrants | North Macedonia | 95.6 /100 | #109 | Exceptional $100,101 |
| Immigrants | Afghanistan | 95.3 /100 | #110 | Exceptional $99,977 |
| Chileans | 95.1 /100 | #111 | Exceptional $99,900 |
| Poles | 94.5 /100 | #112 | Exceptional $99,685 |
| Tongans | 94.2 /100 | #113 | Exceptional $99,604 |
| Immigrants | Western Asia | 94.0 /100 | #114 | Exceptional $99,516 |
| Carpatho Rusyns | 93.7 /100 | #115 | Exceptional $99,449 |
Demographics Similar to Immigrants from Eritrea by Householder Income Ages 25 - 44 years
In terms of householder income ages 25 - 44 years, the demographic groups most similar to Immigrants from Eritrea are Sierra Leonean ($93,435, a difference of 0.030%), German ($93,531, a difference of 0.070%), Guamanian/Chamorro ($93,569, a difference of 0.11%), Spaniard ($93,366, a difference of 0.11%), and Uruguayan ($93,631, a difference of 0.18%).
| Demographics | Rating | Rank | Householder Income Ages 25 - 44 years |
| Immigrants | South America | 42.8 /100 | #178 | Average $94,042 |
| French Canadians | 38.2 /100 | #179 | Fair $93,694 |
| French | 37.8 /100 | #180 | Fair $93,665 |
| Puget Sound Salish | 37.7 /100 | #181 | Fair $93,661 |
| Uruguayans | 37.3 /100 | #182 | Fair $93,631 |
| Guamanians/Chamorros | 36.5 /100 | #183 | Fair $93,569 |
| Germans | 36.0 /100 | #184 | Fair $93,531 |
| Immigrants | Eritrea | 35.2 /100 | #185 | Fair $93,466 |
| Sierra Leoneans | 34.8 /100 | #186 | Fair $93,435 |
| Spaniards | 34.0 /100 | #187 | Fair $93,366 |
| Immigrants | Sierra Leone | 30.9 /100 | #188 | Fair $93,115 |
| Dutch | 30.5 /100 | #189 | Fair $93,081 |
| Welsh | 30.0 /100 | #190 | Fair $93,039 |
| Tlingit-Haida | 29.4 /100 | #191 | Fair $92,987 |
| Immigrants | Costa Rica | 28.2 /100 | #192 | Fair $92,876 |