Immigrants from Ethiopia vs Immigrants from Eritrea Householder Income Ages 25 - 44 years
COMPARE
Immigrants from Ethiopia
Immigrants from Eritrea
Householder Income Ages 25 - 44 years
Householder Income Ages 25 - 44 years Comparison
Immigrants from Ethiopia
Immigrants from Eritrea
$95,256
HOUSEHOLDER INCOME AGES 25 - 44 YEARS
59.5/ 100
METRIC RATING
166th/ 347
METRIC RANK
$93,466
HOUSEHOLDER INCOME AGES 25 - 44 YEARS
35.2/ 100
METRIC RATING
185th/ 347
METRIC RANK
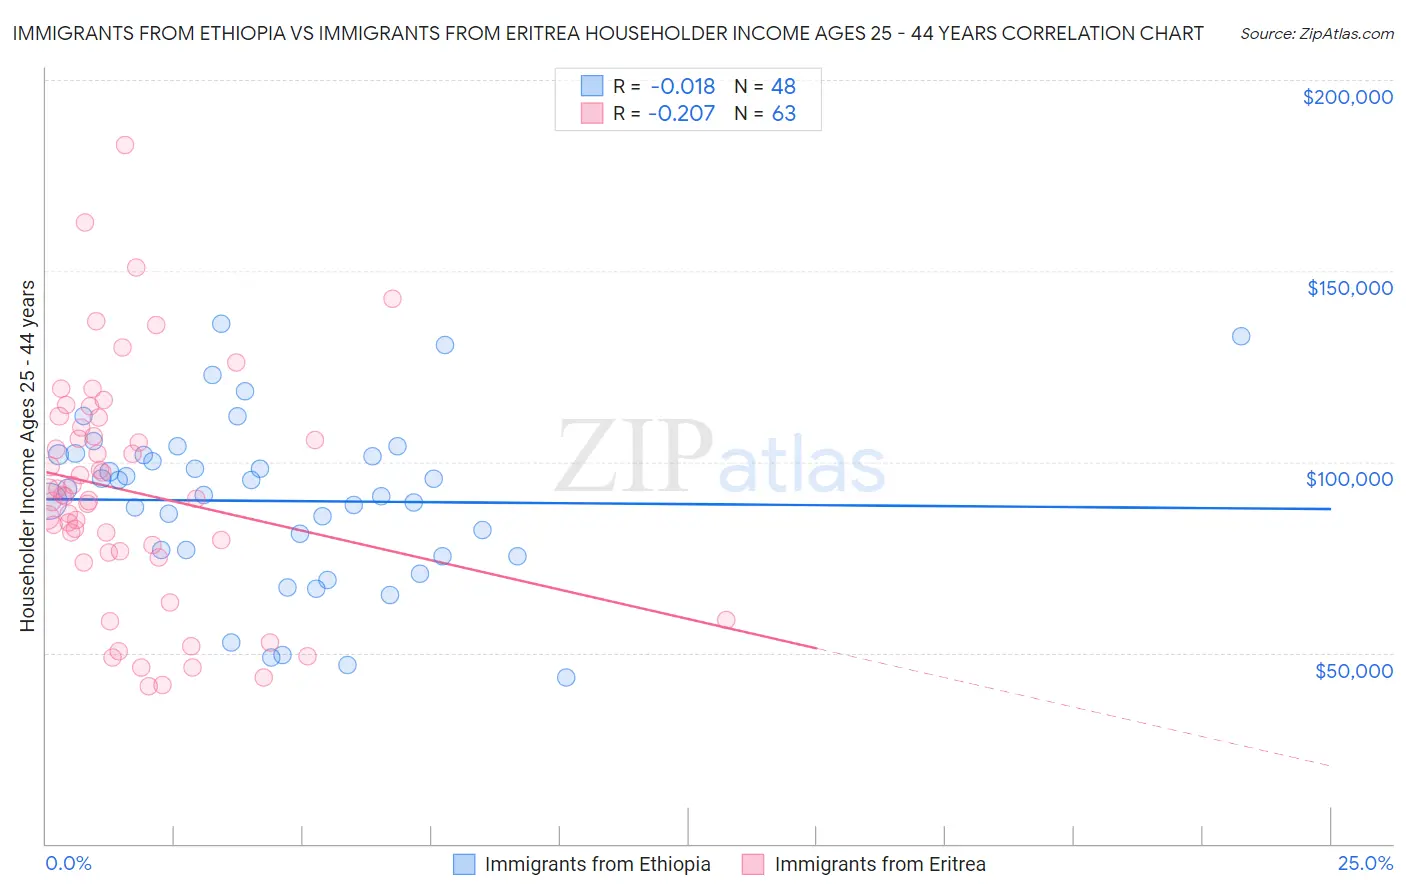
Immigrants from Ethiopia vs Immigrants from Eritrea Householder Income Ages 25 - 44 years Correlation Chart
The statistical analysis conducted on geographies consisting of 211,298,235 people shows no correlation between the proportion of Immigrants from Ethiopia and household income with householder between the ages 25 and 44 in the United States with a correlation coefficient (R) of -0.018 and weighted average of $95,256. Similarly, the statistical analysis conducted on geographies consisting of 104,828,872 people shows a weak negative correlation between the proportion of Immigrants from Eritrea and household income with householder between the ages 25 and 44 in the United States with a correlation coefficient (R) of -0.207 and weighted average of $93,466, a difference of 1.9%.
Householder Income Ages 25 - 44 years Correlation Summary
| Measurement | Immigrants from Ethiopia | Immigrants from Eritrea |
| Minimum | $43,552 | $41,395 |
| Maximum | $136,169 | $183,112 |
| Range | $92,617 | $141,717 |
| Mean | $89,756 | $92,198 |
| Median | $92,049 | $91,003 |
| Interquartile 25% (IQ1) | $76,125 | $76,431 |
| Interquartile 75% (IQ3) | $101,763 | $109,130 |
| Interquartile Range (IQR) | $25,638 | $32,699 |
| Standard Deviation (Sample) | $21,797 | $30,253 |
| Standard Deviation (Population) | $21,568 | $30,012 |
Demographics Similar to Immigrants from Ethiopia and Immigrants from Eritrea by Householder Income Ages 25 - 44 years
In terms of householder income ages 25 - 44 years, the demographic groups most similar to Immigrants from Ethiopia are Immigrants from Nepal ($95,322, a difference of 0.070%), Czechoslovakian ($95,070, a difference of 0.20%), Alsatian ($95,059, a difference of 0.21%), Native Hawaiian ($95,058, a difference of 0.21%), and Slovak ($95,032, a difference of 0.23%). Similarly, the demographic groups most similar to Immigrants from Eritrea are German ($93,531, a difference of 0.070%), Guamanian/Chamorro ($93,569, a difference of 0.11%), Uruguayan ($93,631, a difference of 0.18%), French ($93,665, a difference of 0.21%), and Puget Sound Salish ($93,661, a difference of 0.21%).
| Demographics | Rating | Rank | Householder Income Ages 25 - 44 years |
| Immigrants | Nepal | 60.3 /100 | #165 | Good $95,322 |
| Immigrants | Ethiopia | 59.5 /100 | #166 | Average $95,256 |
| Czechoslovakians | 57.0 /100 | #167 | Average $95,070 |
| Alsatians | 56.8 /100 | #168 | Average $95,059 |
| Native Hawaiians | 56.8 /100 | #169 | Average $95,058 |
| Slovaks | 56.4 /100 | #170 | Average $95,032 |
| Immigrants | Armenia | 54.2 /100 | #171 | Average $94,867 |
| Scottish | 50.8 /100 | #172 | Average $94,622 |
| Finns | 50.6 /100 | #173 | Average $94,610 |
| Colombians | 50.0 /100 | #174 | Average $94,565 |
| English | 48.1 /100 | #175 | Average $94,429 |
| Immigrants | Immigrants | 48.0 /100 | #176 | Average $94,423 |
| Belgians | 45.8 /100 | #177 | Average $94,262 |
| Immigrants | South America | 42.8 /100 | #178 | Average $94,042 |
| French Canadians | 38.2 /100 | #179 | Fair $93,694 |
| French | 37.8 /100 | #180 | Fair $93,665 |
| Puget Sound Salish | 37.7 /100 | #181 | Fair $93,661 |
| Uruguayans | 37.3 /100 | #182 | Fair $93,631 |
| Guamanians/Chamorros | 36.5 /100 | #183 | Fair $93,569 |
| Germans | 36.0 /100 | #184 | Fair $93,531 |
| Immigrants | Eritrea | 35.2 /100 | #185 | Fair $93,466 |