Potawatomi vs Paiute Householder Income Over 65 years
COMPARE
Potawatomi
Paiute
Householder Income Over 65 years
Householder Income Over 65 years Comparison
Potawatomi
Paiute
$54,212
HOUSEHOLDER INCOME OVER 65 YEARS
0.1/ 100
METRIC RATING
272nd/ 347
METRIC RANK
$53,762
HOUSEHOLDER INCOME OVER 65 YEARS
0.1/ 100
METRIC RATING
288th/ 347
METRIC RANK
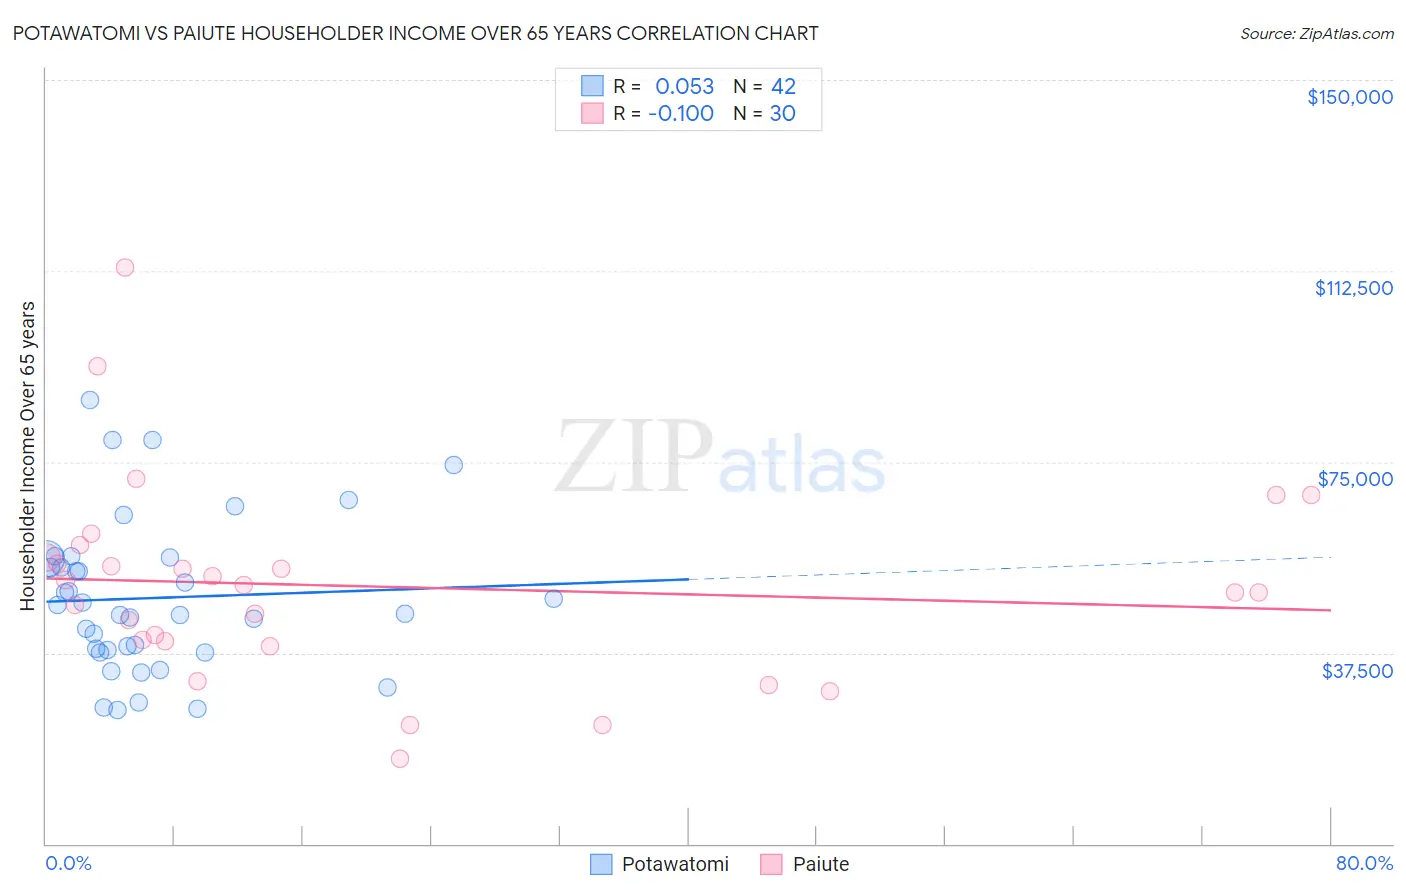
Potawatomi vs Paiute Householder Income Over 65 years Correlation Chart
The statistical analysis conducted on geographies consisting of 117,629,291 people shows a slight positive correlation between the proportion of Potawatomi and household income with householder over the age of 65 in the United States with a correlation coefficient (R) of 0.053 and weighted average of $54,212. Similarly, the statistical analysis conducted on geographies consisting of 58,330,101 people shows a slight negative correlation between the proportion of Paiute and household income with householder over the age of 65 in the United States with a correlation coefficient (R) of -0.100 and weighted average of $53,762, a difference of 0.84%.
Householder Income Over 65 years Correlation Summary
| Measurement | Potawatomi | Paiute |
| Minimum | $26,199 | $16,667 |
| Maximum | $87,267 | $113,167 |
| Range | $61,068 | $96,500 |
| Mean | $48,291 | $50,506 |
| Median | $46,067 | $50,125 |
| Interquartile 25% (IQ1) | $38,035 | $39,874 |
| Interquartile 75% (IQ3) | $56,092 | $56,261 |
| Interquartile Range (IQR) | $18,057 | $16,387 |
| Standard Deviation (Sample) | $14,849 | $19,872 |
| Standard Deviation (Population) | $14,671 | $19,538 |
Demographics Similar to Potawatomi and Paiute by Householder Income Over 65 years
In terms of householder income over 65 years, the demographic groups most similar to Potawatomi are Indonesian ($54,176, a difference of 0.070%), Barbadian ($54,163, a difference of 0.090%), Cherokee ($54,133, a difference of 0.15%), Cree ($54,129, a difference of 0.15%), and Cheyenne ($54,096, a difference of 0.21%). Similarly, the demographic groups most similar to Paiute are Immigrants from Barbados ($53,766, a difference of 0.010%), Iroquois ($53,737, a difference of 0.050%), Chickasaw ($53,732, a difference of 0.060%), Chippewa ($53,847, a difference of 0.16%), and Mexican ($53,897, a difference of 0.25%).
| Demographics | Rating | Rank | Householder Income Over 65 years |
| Immigrants | Senegal | 0.1 /100 | #270 | Tragic $54,447 |
| Liberians | 0.1 /100 | #271 | Tragic $54,356 |
| Potawatomi | 0.1 /100 | #272 | Tragic $54,212 |
| Indonesians | 0.1 /100 | #273 | Tragic $54,176 |
| Barbadians | 0.1 /100 | #274 | Tragic $54,163 |
| Cherokee | 0.1 /100 | #275 | Tragic $54,133 |
| Cree | 0.1 /100 | #276 | Tragic $54,129 |
| Cheyenne | 0.1 /100 | #277 | Tragic $54,096 |
| Immigrants | Ecuador | 0.1 /100 | #278 | Tragic $54,030 |
| Blackfeet | 0.1 /100 | #279 | Tragic $54,029 |
| Immigrants | Jamaica | 0.1 /100 | #280 | Tragic $54,027 |
| Somalis | 0.1 /100 | #281 | Tragic $54,004 |
| Immigrants | Armenia | 0.1 /100 | #282 | Tragic $53,974 |
| Immigrants | Liberia | 0.1 /100 | #283 | Tragic $53,967 |
| Immigrants | Guatemala | 0.1 /100 | #284 | Tragic $53,950 |
| Mexicans | 0.1 /100 | #285 | Tragic $53,897 |
| Chippewa | 0.1 /100 | #286 | Tragic $53,847 |
| Immigrants | Barbados | 0.1 /100 | #287 | Tragic $53,766 |
| Paiute | 0.1 /100 | #288 | Tragic $53,762 |
| Iroquois | 0.1 /100 | #289 | Tragic $53,737 |
| Chickasaw | 0.1 /100 | #290 | Tragic $53,732 |