Zimbabwean vs Senegalese Family Households with Children
COMPARE
Zimbabwean
Senegalese
Family Households with Children
Family Households with Children Comparison
Zimbabweans
Senegalese
27.9%
FAMILY HOUSEHOLDS WITH CHILDREN
95.6/ 100
METRIC RATING
119th/ 347
METRIC RANK
26.6%
FAMILY HOUSEHOLDS WITH CHILDREN
0.4/ 100
METRIC RATING
280th/ 347
METRIC RANK
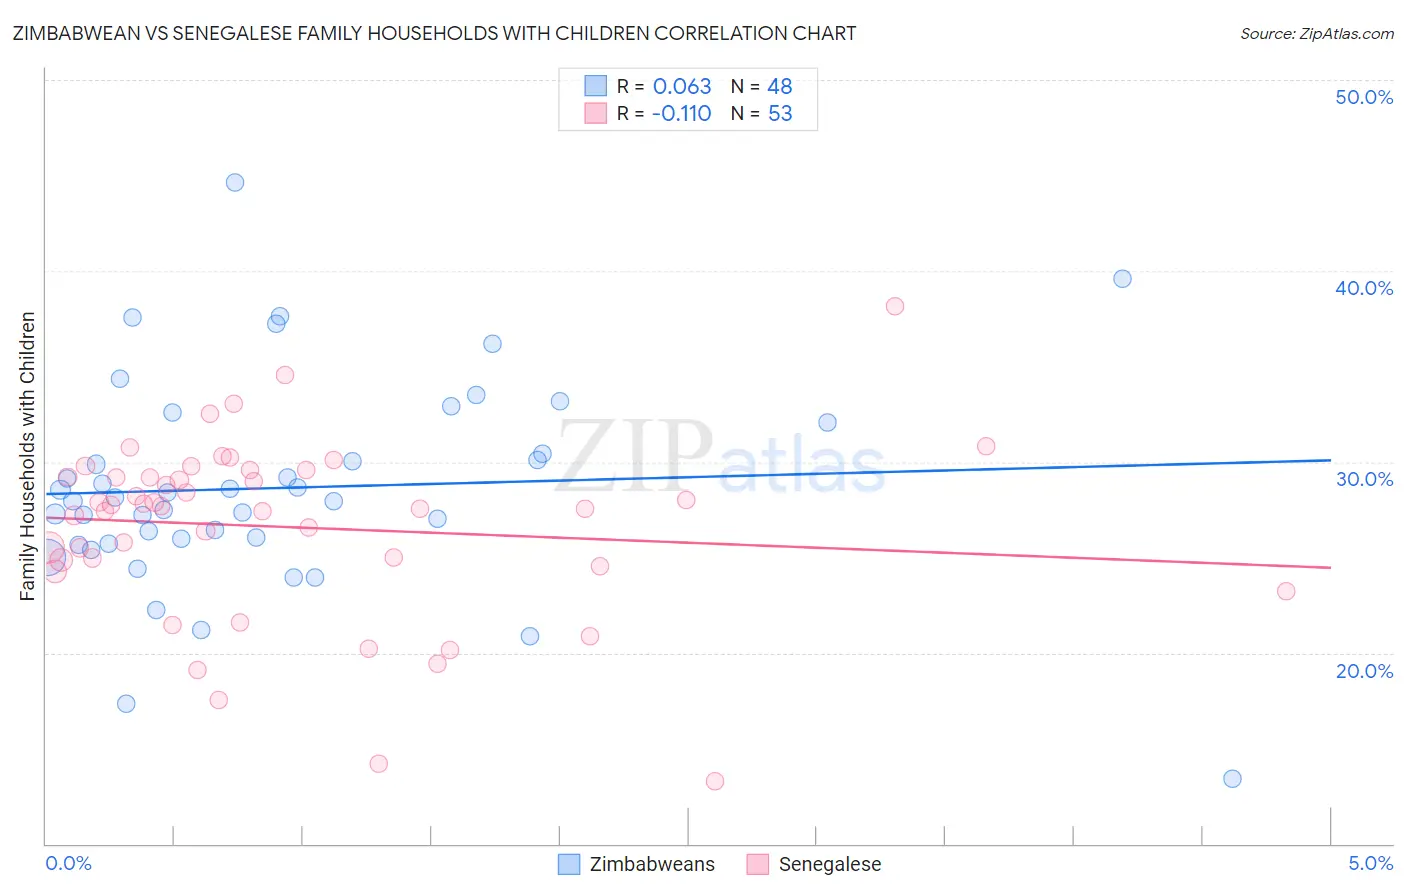
Zimbabwean vs Senegalese Family Households with Children Correlation Chart
The statistical analysis conducted on geographies consisting of 69,170,412 people shows a slight positive correlation between the proportion of Zimbabweans and percentage of family households with children in the United States with a correlation coefficient (R) of 0.063 and weighted average of 27.9%. Similarly, the statistical analysis conducted on geographies consisting of 78,103,218 people shows a poor negative correlation between the proportion of Senegalese and percentage of family households with children in the United States with a correlation coefficient (R) of -0.110 and weighted average of 26.6%, a difference of 4.9%.
Family Households with Children Correlation Summary
| Measurement | Zimbabwean | Senegalese |
| Minimum | 13.4% | 13.3% |
| Maximum | 44.7% | 38.1% |
| Range | 31.3% | 24.8% |
| Mean | 28.6% | 26.6% |
| Median | 28.1% | 27.7% |
| Interquartile 25% (IQ1) | 25.8% | 24.7% |
| Interquartile 75% (IQ3) | 31.3% | 29.4% |
| Interquartile Range (IQR) | 5.4% | 4.7% |
| Standard Deviation (Sample) | 5.6% | 4.7% |
| Standard Deviation (Population) | 5.5% | 4.7% |
Similar Demographics by Family Households with Children
Demographics Similar to Zimbabweans by Family Households with Children
In terms of family households with children, the demographic groups most similar to Zimbabweans are European (27.9%, a difference of 0.030%), Immigrants from Malaysia (27.9%, a difference of 0.040%), Central American Indian (27.9%, a difference of 0.040%), Pakistani (27.9%, a difference of 0.050%), and Immigrants from Africa (28.0%, a difference of 0.18%).
| Demographics | Rating | Rank | Family Households with Children |
| Immigrants | Middle Africa | 97.0 /100 | #112 | Exceptional 28.0% |
| Arabs | 97.0 /100 | #113 | Exceptional 28.0% |
| South American Indians | 96.9 /100 | #114 | Exceptional 28.0% |
| Immigrants | Africa | 96.8 /100 | #115 | Exceptional 28.0% |
| Pakistanis | 96.0 /100 | #116 | Exceptional 27.9% |
| Immigrants | Malaysia | 95.9 /100 | #117 | Exceptional 27.9% |
| Central American Indians | 95.9 /100 | #118 | Exceptional 27.9% |
| Zimbabweans | 95.6 /100 | #119 | Exceptional 27.9% |
| Europeans | 95.4 /100 | #120 | Exceptional 27.9% |
| Immigrants | Western Asia | 93.6 /100 | #121 | Exceptional 27.9% |
| Immigrants | Zimbabwe | 92.8 /100 | #122 | Exceptional 27.8% |
| Immigrants | Northern Africa | 91.8 /100 | #123 | Exceptional 27.8% |
| Immigrants | Singapore | 90.8 /100 | #124 | Exceptional 27.8% |
| Ecuadorians | 90.8 /100 | #125 | Exceptional 27.8% |
| Immigrants | Ethiopia | 90.5 /100 | #126 | Exceptional 27.8% |
Demographics Similar to Senegalese by Family Households with Children
In terms of family households with children, the demographic groups most similar to Senegalese are Finnish (26.6%, a difference of 0.020%), Immigrants from Europe (26.6%, a difference of 0.050%), Lithuanian (26.6%, a difference of 0.090%), Celtic (26.6%, a difference of 0.10%), and French American Indian (26.6%, a difference of 0.11%).
| Demographics | Rating | Rank | Family Households with Children |
| Immigrants | Hungary | 0.6 /100 | #273 | Tragic 26.7% |
| Eastern Europeans | 0.6 /100 | #274 | Tragic 26.7% |
| Immigrants | Northern Europe | 0.5 /100 | #275 | Tragic 26.7% |
| Immigrants | Spain | 0.5 /100 | #276 | Tragic 26.6% |
| Celtics | 0.4 /100 | #277 | Tragic 26.6% |
| Immigrants | Europe | 0.4 /100 | #278 | Tragic 26.6% |
| Finns | 0.4 /100 | #279 | Tragic 26.6% |
| Senegalese | 0.4 /100 | #280 | Tragic 26.6% |
| Lithuanians | 0.3 /100 | #281 | Tragic 26.6% |
| French American Indians | 0.3 /100 | #282 | Tragic 26.6% |
| Immigrants | North America | 0.3 /100 | #283 | Tragic 26.6% |
| Immigrants | Canada | 0.3 /100 | #284 | Tragic 26.5% |
| Cambodians | 0.2 /100 | #285 | Tragic 26.5% |
| Immigrants | Senegal | 0.2 /100 | #286 | Tragic 26.5% |
| Shoshone | 0.2 /100 | #287 | Tragic 26.5% |