Zimbabwean vs Immigrants from Syria Births to Unmarried Women
COMPARE
Zimbabwean
Immigrants from Syria
Births to Unmarried Women
Births to Unmarried Women Comparison
Zimbabweans
Immigrants from Syria
28.7%
BIRTHS TO UNMARRIED WOMEN
98.2/ 100
METRIC RATING
78th/ 347
METRIC RANK
29.4%
BIRTHS TO UNMARRIED WOMEN
95.7/ 100
METRIC RATING
98th/ 347
METRIC RANK
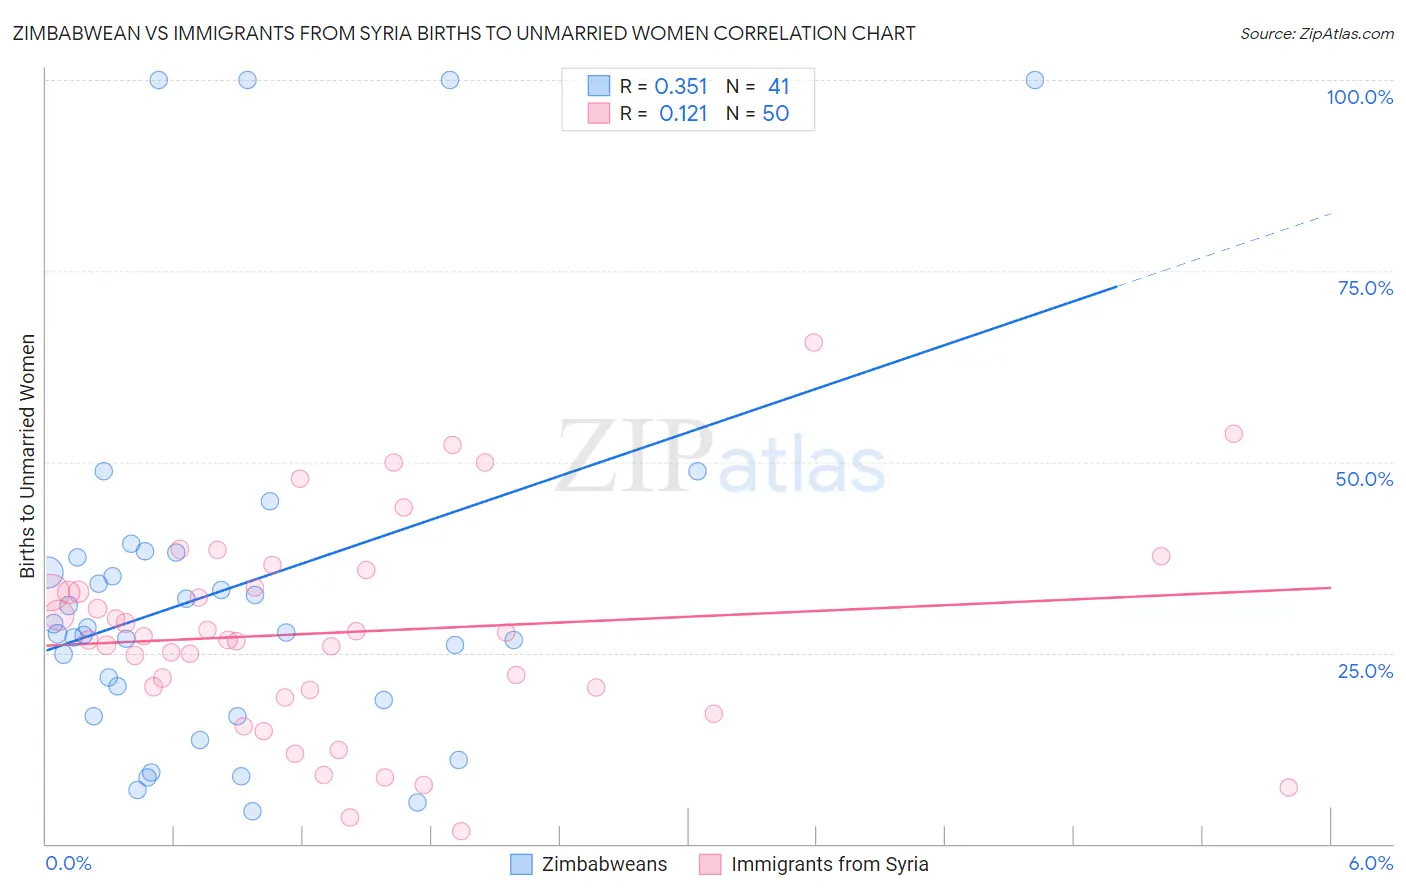
Zimbabwean vs Immigrants from Syria Births to Unmarried Women Correlation Chart
The statistical analysis conducted on geographies consisting of 68,374,099 people shows a mild positive correlation between the proportion of Zimbabweans and percentage of births to unmarried women in the United States with a correlation coefficient (R) of 0.351 and weighted average of 28.7%. Similarly, the statistical analysis conducted on geographies consisting of 168,026,098 people shows a poor positive correlation between the proportion of Immigrants from Syria and percentage of births to unmarried women in the United States with a correlation coefficient (R) of 0.121 and weighted average of 29.4%, a difference of 2.3%.
Births to Unmarried Women Correlation Summary
| Measurement | Zimbabwean | Immigrants from Syria |
| Minimum | 4.3% | 1.7% |
| Maximum | 100.0% | 65.6% |
| Range | 95.7% | 63.9% |
| Mean | 33.3% | 27.7% |
| Median | 27.6% | 26.9% |
| Interquartile 25% (IQ1) | 17.8% | 20.2% |
| Interquartile 75% (IQ3) | 37.9% | 33.5% |
| Interquartile Range (IQR) | 20.1% | 13.4% |
| Standard Deviation (Sample) | 25.0% | 13.6% |
| Standard Deviation (Population) | 24.7% | 13.5% |
Demographics Similar to Zimbabweans and Immigrants from Syria by Births to Unmarried Women
In terms of births to unmarried women, the demographic groups most similar to Zimbabweans are Danish (28.7%, a difference of 0.020%), Immigrants from Afghanistan (28.7%, a difference of 0.050%), Immigrants from Austria (28.7%, a difference of 0.090%), Romanian (28.7%, a difference of 0.20%), and Immigrants from Kuwait (28.8%, a difference of 0.27%). Similarly, the demographic groups most similar to Immigrants from Syria are Immigrants from South Africa (29.3%, a difference of 0.020%), Norwegian (29.3%, a difference of 0.070%), Immigrants from Vietnam (29.3%, a difference of 0.30%), Ukrainian (29.2%, a difference of 0.43%), and Estonian (29.2%, a difference of 0.55%).
| Demographics | Rating | Rank | Births to Unmarried Women |
| Zimbabweans | 98.2 /100 | #78 | Exceptional 28.7% |
| Danes | 98.2 /100 | #79 | Exceptional 28.7% |
| Immigrants | Afghanistan | 98.1 /100 | #80 | Exceptional 28.7% |
| Immigrants | Austria | 98.1 /100 | #81 | Exceptional 28.7% |
| Romanians | 98.0 /100 | #82 | Exceptional 28.7% |
| Immigrants | Kuwait | 98.0 /100 | #83 | Exceptional 28.8% |
| Immigrants | Poland | 97.6 /100 | #84 | Exceptional 28.9% |
| Sri Lankans | 97.5 /100 | #85 | Exceptional 28.9% |
| Immigrants | Jordan | 97.4 /100 | #86 | Exceptional 29.0% |
| Taiwanese | 97.3 /100 | #87 | Exceptional 29.0% |
| Immigrants | France | 97.3 /100 | #88 | Exceptional 29.0% |
| Immigrants | Saudi Arabia | 97.0 /100 | #89 | Exceptional 29.1% |
| Immigrants | Latvia | 96.8 /100 | #90 | Exceptional 29.1% |
| Immigrants | Fiji | 96.6 /100 | #91 | Exceptional 29.2% |
| Arabs | 96.5 /100 | #92 | Exceptional 29.2% |
| Estonians | 96.5 /100 | #93 | Exceptional 29.2% |
| Ukrainians | 96.3 /100 | #94 | Exceptional 29.2% |
| Immigrants | Vietnam | 96.1 /100 | #95 | Exceptional 29.3% |
| Norwegians | 95.8 /100 | #96 | Exceptional 29.3% |
| Immigrants | South Africa | 95.7 /100 | #97 | Exceptional 29.3% |
| Immigrants | Syria | 95.7 /100 | #98 | Exceptional 29.4% |