Zimbabwean vs Black/African American Births to Unmarried Women
COMPARE
Zimbabwean
Black/African American
Births to Unmarried Women
Births to Unmarried Women Comparison
Zimbabweans
Blacks/African Americans
28.7%
BIRTHS TO UNMARRIED WOMEN
98.2/ 100
METRIC RATING
78th/ 347
METRIC RANK
44.3%
BIRTHS TO UNMARRIED WOMEN
0.0/ 100
METRIC RATING
333rd/ 347
METRIC RANK
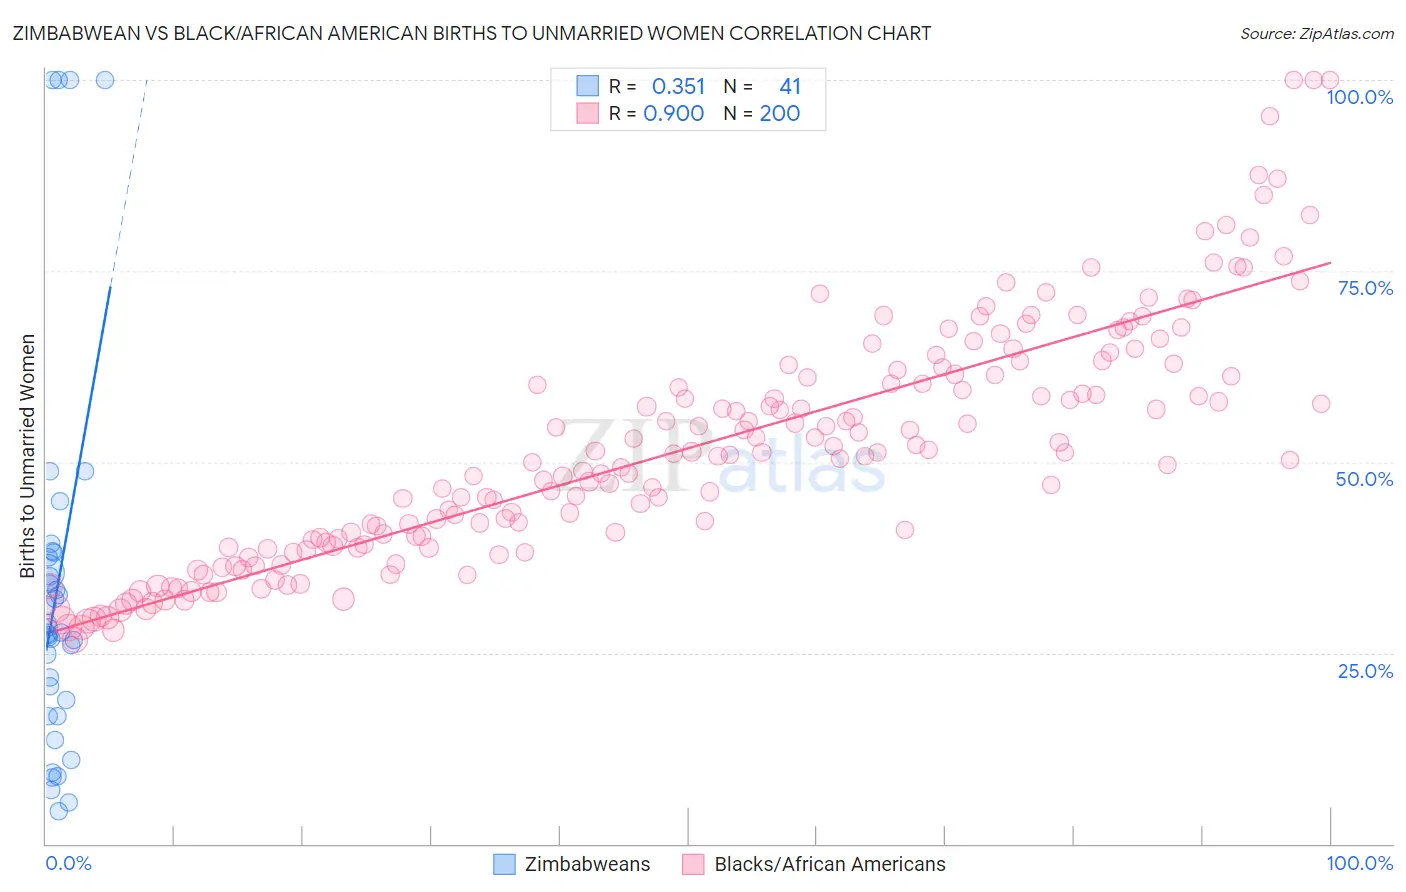
Zimbabwean vs Black/African American Births to Unmarried Women Correlation Chart
The statistical analysis conducted on geographies consisting of 68,374,099 people shows a mild positive correlation between the proportion of Zimbabweans and percentage of births to unmarried women in the United States with a correlation coefficient (R) of 0.351 and weighted average of 28.7%. Similarly, the statistical analysis conducted on geographies consisting of 506,152,506 people shows a very strong positive correlation between the proportion of Blacks/African Americans and percentage of births to unmarried women in the United States with a correlation coefficient (R) of 0.900 and weighted average of 44.3%, a difference of 54.4%.
Births to Unmarried Women Correlation Summary
| Measurement | Zimbabwean | Black/African American |
| Minimum | 4.3% | 26.7% |
| Maximum | 100.0% | 100.0% |
| Range | 95.7% | 73.3% |
| Mean | 33.3% | 51.8% |
| Median | 27.6% | 50.9% |
| Interquartile 25% (IQ1) | 17.8% | 39.1% |
| Interquartile 75% (IQ3) | 37.9% | 61.4% |
| Interquartile Range (IQR) | 20.1% | 22.4% |
| Standard Deviation (Sample) | 25.0% | 15.6% |
| Standard Deviation (Population) | 24.7% | 15.6% |
Similar Demographics by Births to Unmarried Women
Demographics Similar to Zimbabweans by Births to Unmarried Women
In terms of births to unmarried women, the demographic groups most similar to Zimbabweans are Danish (28.7%, a difference of 0.020%), Immigrants from Afghanistan (28.7%, a difference of 0.050%), Immigrants from Austria (28.7%, a difference of 0.090%), Immigrants from Northern Europe (28.6%, a difference of 0.16%), and Romanian (28.7%, a difference of 0.20%).
| Demographics | Rating | Rank | Births to Unmarried Women |
| Jordanians | 98.5 /100 | #71 | Exceptional 28.5% |
| Immigrants | Sweden | 98.5 /100 | #72 | Exceptional 28.5% |
| Albanians | 98.5 /100 | #73 | Exceptional 28.5% |
| Immigrants | Bolivia | 98.5 /100 | #74 | Exceptional 28.6% |
| Immigrants | Switzerland | 98.4 /100 | #75 | Exceptional 28.6% |
| Israelis | 98.4 /100 | #76 | Exceptional 28.6% |
| Immigrants | Northern Europe | 98.3 /100 | #77 | Exceptional 28.6% |
| Zimbabweans | 98.2 /100 | #78 | Exceptional 28.7% |
| Danes | 98.2 /100 | #79 | Exceptional 28.7% |
| Immigrants | Afghanistan | 98.1 /100 | #80 | Exceptional 28.7% |
| Immigrants | Austria | 98.1 /100 | #81 | Exceptional 28.7% |
| Romanians | 98.0 /100 | #82 | Exceptional 28.7% |
| Immigrants | Kuwait | 98.0 /100 | #83 | Exceptional 28.8% |
| Immigrants | Poland | 97.6 /100 | #84 | Exceptional 28.9% |
| Sri Lankans | 97.5 /100 | #85 | Exceptional 28.9% |
Demographics Similar to Blacks/African Americans by Births to Unmarried Women
In terms of births to unmarried women, the demographic groups most similar to Blacks/African Americans are Yuman (44.4%, a difference of 0.17%), Colville (45.3%, a difference of 2.3%), Kiowa (43.1%, a difference of 2.7%), Native/Alaskan (43.0%, a difference of 3.0%), and Puerto Rican (45.7%, a difference of 3.1%).
| Demographics | Rating | Rank | Births to Unmarried Women |
| Immigrants | Cuba | 0.0 /100 | #326 | Tragic 41.5% |
| Tsimshian | 0.0 /100 | #327 | Tragic 42.2% |
| Immigrants | Cabo Verde | 0.0 /100 | #328 | Tragic 42.2% |
| Paiute | 0.0 /100 | #329 | Tragic 42.5% |
| Chippewa | 0.0 /100 | #330 | Tragic 42.6% |
| Natives/Alaskans | 0.0 /100 | #331 | Tragic 43.0% |
| Kiowa | 0.0 /100 | #332 | Tragic 43.1% |
| Blacks/African Americans | 0.0 /100 | #333 | Tragic 44.3% |
| Yuman | 0.0 /100 | #334 | Tragic 44.4% |
| Colville | 0.0 /100 | #335 | Tragic 45.3% |
| Puerto Ricans | 0.0 /100 | #336 | Tragic 45.7% |
| Houma | 0.0 /100 | #337 | Tragic 46.6% |
| Arapaho | 0.0 /100 | #338 | Tragic 47.1% |
| Lumbee | 0.0 /100 | #339 | Tragic 48.2% |
| Tohono O'odham | 0.0 /100 | #340 | Tragic 49.8% |