Taiwanese vs Immigrants from Syria Births to Unmarried Women
COMPARE
Taiwanese
Immigrants from Syria
Births to Unmarried Women
Births to Unmarried Women Comparison
Taiwanese
Immigrants from Syria
29.0%
BIRTHS TO UNMARRIED WOMEN
97.3/ 100
METRIC RATING
87th/ 347
METRIC RANK
29.4%
BIRTHS TO UNMARRIED WOMEN
95.7/ 100
METRIC RATING
98th/ 347
METRIC RANK
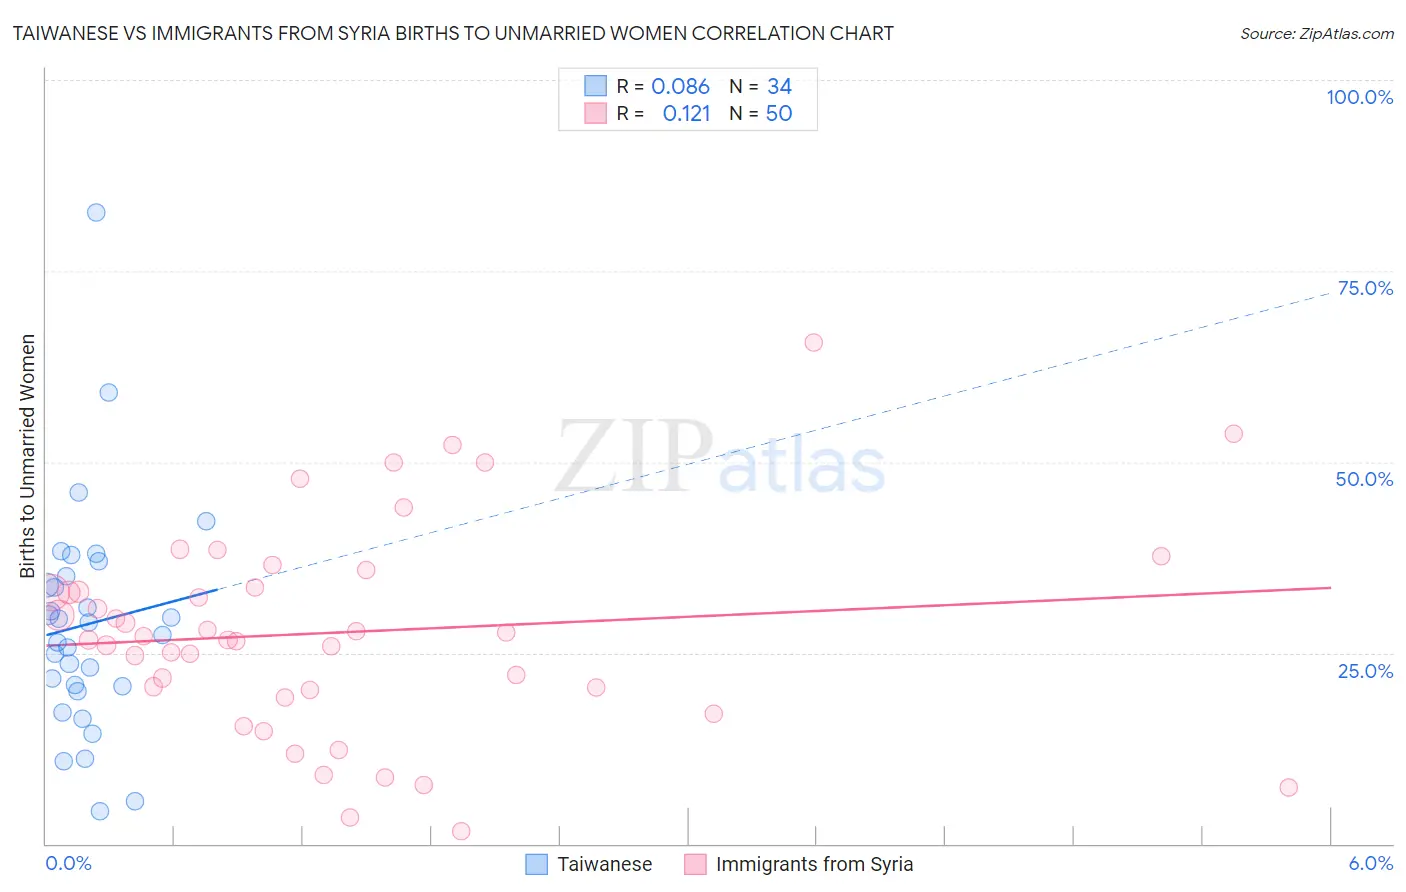
Taiwanese vs Immigrants from Syria Births to Unmarried Women Correlation Chart
The statistical analysis conducted on geographies consisting of 31,322,032 people shows a slight positive correlation between the proportion of Taiwanese and percentage of births to unmarried women in the United States with a correlation coefficient (R) of 0.086 and weighted average of 29.0%. Similarly, the statistical analysis conducted on geographies consisting of 168,026,098 people shows a poor positive correlation between the proportion of Immigrants from Syria and percentage of births to unmarried women in the United States with a correlation coefficient (R) of 0.121 and weighted average of 29.4%, a difference of 1.3%.
Births to Unmarried Women Correlation Summary
| Measurement | Taiwanese | Immigrants from Syria |
| Minimum | 4.2% | 1.7% |
| Maximum | 82.7% | 65.6% |
| Range | 78.5% | 63.9% |
| Mean | 28.7% | 27.7% |
| Median | 28.1% | 26.9% |
| Interquartile 25% (IQ1) | 20.6% | 20.2% |
| Interquartile 75% (IQ3) | 35.0% | 33.5% |
| Interquartile Range (IQR) | 14.4% | 13.4% |
| Standard Deviation (Sample) | 14.9% | 13.6% |
| Standard Deviation (Population) | 14.7% | 13.5% |
Demographics Similar to Taiwanese and Immigrants from Syria by Births to Unmarried Women
In terms of births to unmarried women, the demographic groups most similar to Taiwanese are Immigrants from France (29.0%, a difference of 0.010%), Immigrants from Jordan (29.0%, a difference of 0.070%), Sri Lankan (28.9%, a difference of 0.15%), Immigrants from Saudi Arabia (29.1%, a difference of 0.28%), and Immigrants from Poland (28.9%, a difference of 0.32%). Similarly, the demographic groups most similar to Immigrants from Syria are Immigrants from South Africa (29.3%, a difference of 0.020%), Norwegian (29.3%, a difference of 0.070%), Immigrants from Denmark (29.4%, a difference of 0.24%), Luxembourger (29.4%, a difference of 0.24%), and Immigrants from Vietnam (29.3%, a difference of 0.30%).
| Demographics | Rating | Rank | Births to Unmarried Women |
| Romanians | 98.0 /100 | #82 | Exceptional 28.7% |
| Immigrants | Kuwait | 98.0 /100 | #83 | Exceptional 28.8% |
| Immigrants | Poland | 97.6 /100 | #84 | Exceptional 28.9% |
| Sri Lankans | 97.5 /100 | #85 | Exceptional 28.9% |
| Immigrants | Jordan | 97.4 /100 | #86 | Exceptional 29.0% |
| Taiwanese | 97.3 /100 | #87 | Exceptional 29.0% |
| Immigrants | France | 97.3 /100 | #88 | Exceptional 29.0% |
| Immigrants | Saudi Arabia | 97.0 /100 | #89 | Exceptional 29.1% |
| Immigrants | Latvia | 96.8 /100 | #90 | Exceptional 29.1% |
| Immigrants | Fiji | 96.6 /100 | #91 | Exceptional 29.2% |
| Arabs | 96.5 /100 | #92 | Exceptional 29.2% |
| Estonians | 96.5 /100 | #93 | Exceptional 29.2% |
| Ukrainians | 96.3 /100 | #94 | Exceptional 29.2% |
| Immigrants | Vietnam | 96.1 /100 | #95 | Exceptional 29.3% |
| Norwegians | 95.8 /100 | #96 | Exceptional 29.3% |
| Immigrants | South Africa | 95.7 /100 | #97 | Exceptional 29.3% |
| Immigrants | Syria | 95.7 /100 | #98 | Exceptional 29.4% |
| Immigrants | Denmark | 95.3 /100 | #99 | Exceptional 29.4% |
| Luxembourgers | 95.2 /100 | #100 | Exceptional 29.4% |
| Immigrants | Northern Africa | 94.7 /100 | #101 | Exceptional 29.5% |
| Australians | 94.6 /100 | #102 | Exceptional 29.5% |