Yup'ik vs Immigrants from Pakistan Unemployment Among Women with Children Under 6 years
COMPARE
Yup'ik
Immigrants from Pakistan
Unemployment Among Women with Children Under 6 years
Unemployment Among Women with Children Under 6 years Comparison
Yup'ik
Immigrants from Pakistan
21.1%
UNEMPLOYMENT AMONG WOMEN WITH CHILDREN UNDER 6 YEARS
0.0/ 100
METRIC RATING
347th/ 347
METRIC RANK
7.2%
UNEMPLOYMENT AMONG WOMEN WITH CHILDREN UNDER 6 YEARS
97.2/ 100
METRIC RATING
106th/ 347
METRIC RANK
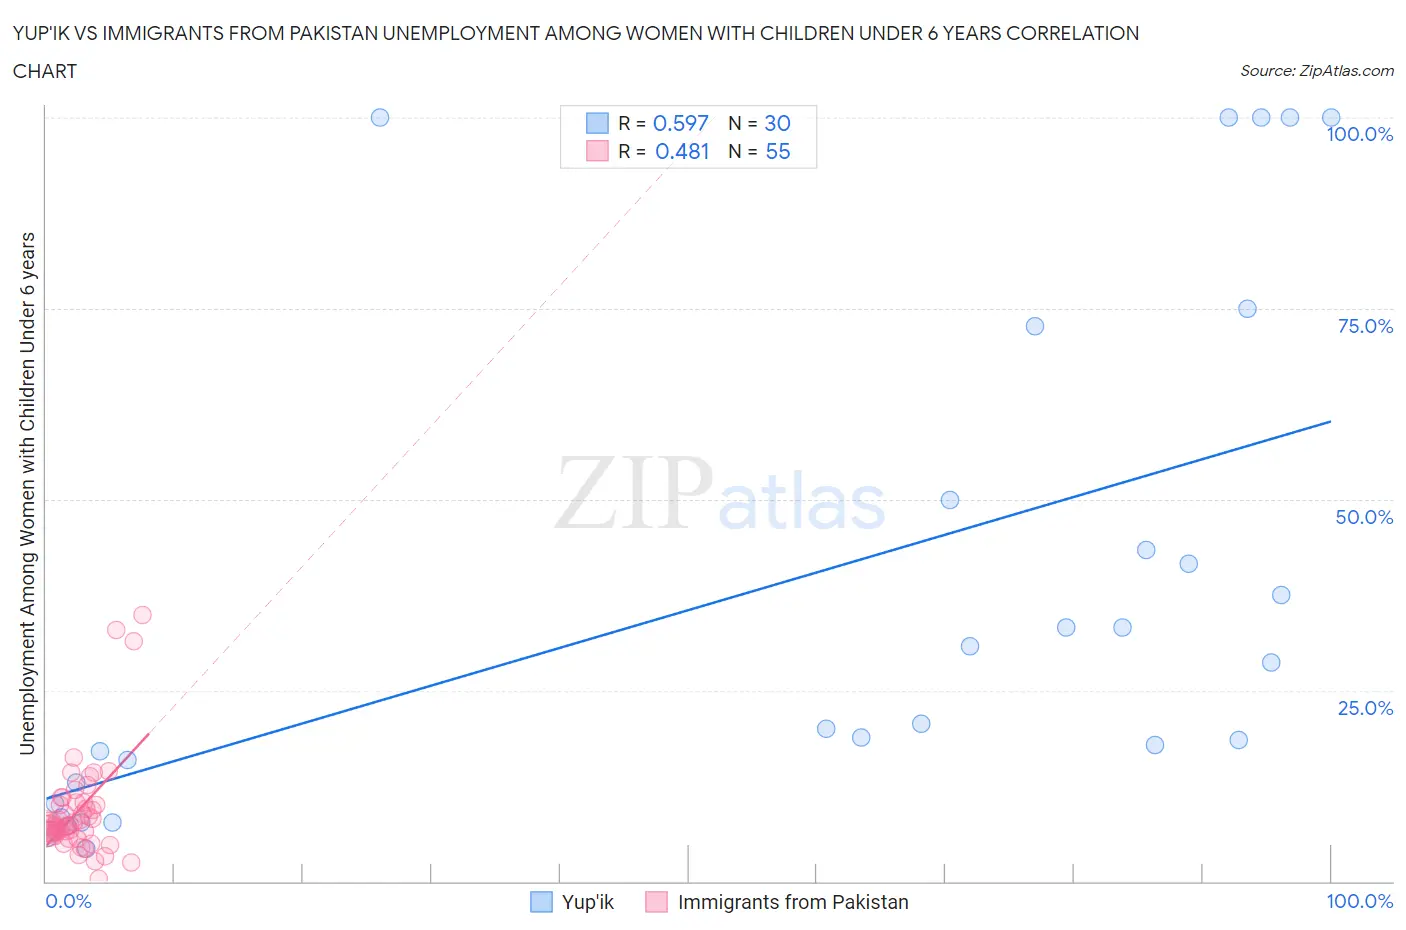
Yup'ik vs Immigrants from Pakistan Unemployment Among Women with Children Under 6 years Correlation Chart
The statistical analysis conducted on geographies consisting of 36,929,560 people shows a substantial positive correlation between the proportion of Yup'ik and unemployment rate among women with children under the age of 6 in the United States with a correlation coefficient (R) of 0.597 and weighted average of 21.1%. Similarly, the statistical analysis conducted on geographies consisting of 233,137,568 people shows a moderate positive correlation between the proportion of Immigrants from Pakistan and unemployment rate among women with children under the age of 6 in the United States with a correlation coefficient (R) of 0.481 and weighted average of 7.2%, a difference of 192.5%.
Unemployment Among Women with Children Under 6 years Correlation Summary
| Measurement | Yup'ik | Immigrants from Pakistan |
| Minimum | 4.2% | 0.40% |
| Maximum | 100.0% | 34.9% |
| Range | 95.8% | 34.5% |
| Mean | 38.0% | 9.2% |
| Median | 24.6% | 7.3% |
| Interquartile 25% (IQ1) | 12.9% | 6.5% |
| Interquartile 75% (IQ3) | 50.0% | 10.3% |
| Interquartile Range (IQR) | 37.1% | 3.8% |
| Standard Deviation (Sample) | 33.3% | 6.6% |
| Standard Deviation (Population) | 32.7% | 6.6% |
Similar Demographics by Unemployment Among Women with Children Under 6 years
Demographics Similar to Yup'ik by Unemployment Among Women with Children Under 6 years
In terms of unemployment among women with children under 6 years, the demographic groups most similar to Yup'ik are Arapaho (19.0%, a difference of 10.6%), Inupiat (17.7%, a difference of 18.9%), Hopi (16.8%, a difference of 25.5%), Crow (14.6%, a difference of 43.8%), and Yuman (14.6%, a difference of 44.0%).
| Demographics | Rating | Rank | Unemployment Among Women with Children Under 6 years |
| Natives/Alaskans | 0.0 /100 | #333 | Tragic 11.5% |
| Apache | 0.0 /100 | #334 | Tragic 12.3% |
| Puerto Ricans | 0.0 /100 | #335 | Tragic 12.5% |
| Shoshone | 0.0 /100 | #336 | Tragic 13.2% |
| Chippewa | 0.0 /100 | #337 | Tragic 13.3% |
| Pima | 0.0 /100 | #338 | Tragic 13.4% |
| Navajo | 0.0 /100 | #339 | Tragic 13.5% |
| Immigrants | Yemen | 0.0 /100 | #340 | Tragic 13.5% |
| Lumbee | 0.0 /100 | #341 | Tragic 13.8% |
| Yuman | 0.0 /100 | #342 | Tragic 14.6% |
| Crow | 0.0 /100 | #343 | Tragic 14.6% |
| Hopi | 0.0 /100 | #344 | Tragic 16.8% |
| Inupiat | 0.0 /100 | #345 | Tragic 17.7% |
| Arapaho | 0.0 /100 | #346 | Tragic 19.0% |
| Yup'ik | 0.0 /100 | #347 | Tragic 21.1% |
Demographics Similar to Immigrants from Pakistan by Unemployment Among Women with Children Under 6 years
In terms of unemployment among women with children under 6 years, the demographic groups most similar to Immigrants from Pakistan are Venezuelan (7.2%, a difference of 0.010%), Immigrants from Kazakhstan (7.2%, a difference of 0.020%), Immigrants from Egypt (7.2%, a difference of 0.030%), Immigrants from Saudi Arabia (7.2%, a difference of 0.10%), and Immigrants from Nicaragua (7.2%, a difference of 0.11%).
| Demographics | Rating | Rank | Unemployment Among Women with Children Under 6 years |
| Immigrants | Europe | 97.5 /100 | #99 | Exceptional 7.2% |
| Immigrants | Northern Europe | 97.4 /100 | #100 | Exceptional 7.2% |
| Chileans | 97.4 /100 | #101 | Exceptional 7.2% |
| Immigrants | Nicaragua | 97.3 /100 | #102 | Exceptional 7.2% |
| Immigrants | Saudi Arabia | 97.3 /100 | #103 | Exceptional 7.2% |
| Immigrants | Egypt | 97.2 /100 | #104 | Exceptional 7.2% |
| Venezuelans | 97.2 /100 | #105 | Exceptional 7.2% |
| Immigrants | Pakistan | 97.2 /100 | #106 | Exceptional 7.2% |
| Immigrants | Kazakhstan | 97.1 /100 | #107 | Exceptional 7.2% |
| Eastern Europeans | 96.9 /100 | #108 | Exceptional 7.2% |
| Australians | 96.9 /100 | #109 | Exceptional 7.2% |
| Palestinians | 96.8 /100 | #110 | Exceptional 7.2% |
| Norwegians | 96.7 /100 | #111 | Exceptional 7.2% |
| Israelis | 96.5 /100 | #112 | Exceptional 7.2% |
| Nicaraguans | 96.3 /100 | #113 | Exceptional 7.2% |