Chilean vs Immigrants from Pakistan Single Mother Households
COMPARE
Chilean
Immigrants from Pakistan
Single Mother Households
Single Mother Households Comparison
Chileans
Immigrants from Pakistan
6.1%
SINGLE MOTHER HOUSEHOLDS
74.2/ 100
METRIC RATING
157th/ 347
METRIC RANK
6.0%
SINGLE MOTHER HOUSEHOLDS
88.4/ 100
METRIC RATING
137th/ 347
METRIC RANK
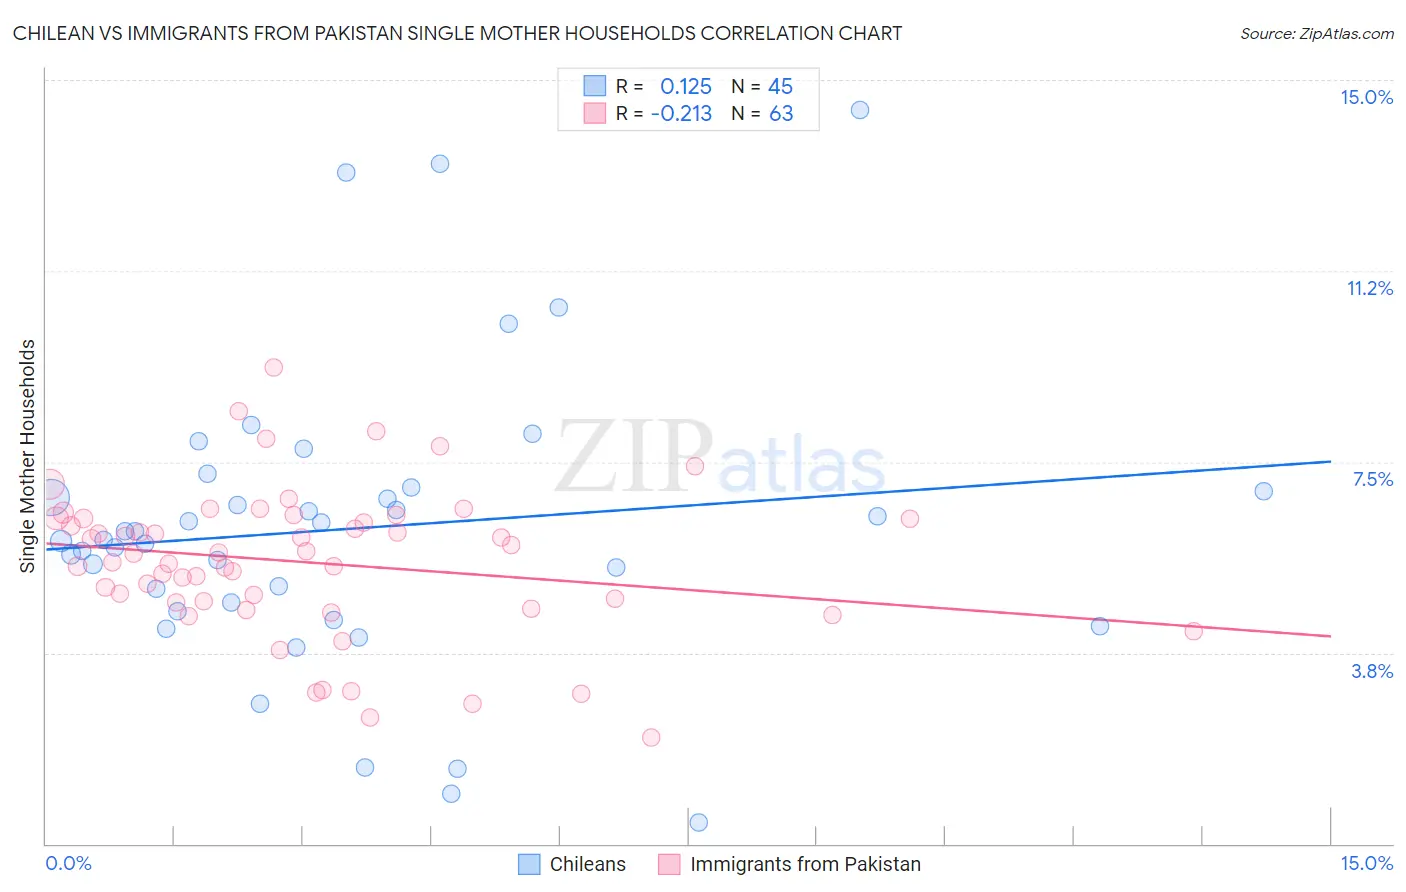
Chilean vs Immigrants from Pakistan Single Mother Households Correlation Chart
The statistical analysis conducted on geographies consisting of 256,326,378 people shows a poor positive correlation between the proportion of Chileans and percentage of single mother households in the United States with a correlation coefficient (R) of 0.125 and weighted average of 6.1%. Similarly, the statistical analysis conducted on geographies consisting of 283,504,860 people shows a weak negative correlation between the proportion of Immigrants from Pakistan and percentage of single mother households in the United States with a correlation coefficient (R) of -0.213 and weighted average of 6.0%, a difference of 2.8%.
Single Mother Households Correlation Summary
| Measurement | Chilean | Immigrants from Pakistan |
| Minimum | 0.42% | 2.1% |
| Maximum | 14.4% | 9.4% |
| Range | 14.0% | 7.3% |
| Mean | 6.2% | 5.5% |
| Median | 6.0% | 5.7% |
| Interquartile 25% (IQ1) | 4.6% | 4.7% |
| Interquartile 75% (IQ3) | 7.0% | 6.4% |
| Interquartile Range (IQR) | 2.3% | 1.7% |
| Standard Deviation (Sample) | 2.9% | 1.5% |
| Standard Deviation (Population) | 2.9% | 1.4% |
Demographics Similar to Chileans and Immigrants from Pakistan by Single Mother Households
In terms of single mother households, the demographic groups most similar to Chileans are Native Hawaiian (6.1%, a difference of 0.11%), White/Caucasian (6.1%, a difference of 0.34%), Immigrants from Philippines (6.1%, a difference of 0.67%), Immigrants from Brazil (6.1%, a difference of 0.74%), and Pakistani (6.1%, a difference of 0.79%). Similarly, the demographic groups most similar to Immigrants from Pakistan are Icelander (6.0%, a difference of 0.41%), Syrian (6.0%, a difference of 0.64%), French (6.0%, a difference of 0.71%), Tsimshian (6.0%, a difference of 0.81%), and Immigrants from Egypt (6.0%, a difference of 0.86%).
| Demographics | Rating | Rank | Single Mother Households |
| Immigrants | Pakistan | 88.4 /100 | #137 | Excellent 6.0% |
| Icelanders | 86.9 /100 | #138 | Excellent 6.0% |
| Syrians | 86.0 /100 | #139 | Excellent 6.0% |
| French | 85.7 /100 | #140 | Excellent 6.0% |
| Tsimshian | 85.2 /100 | #141 | Excellent 6.0% |
| Immigrants | Egypt | 85.0 /100 | #142 | Excellent 6.0% |
| Immigrants | Iraq | 84.8 /100 | #143 | Excellent 6.0% |
| Koreans | 84.4 /100 | #144 | Excellent 6.0% |
| Arabs | 84.0 /100 | #145 | Excellent 6.0% |
| French Canadians | 82.6 /100 | #146 | Excellent 6.0% |
| Immigrants | Jordan | 82.3 /100 | #147 | Excellent 6.0% |
| Scotch-Irish | 82.0 /100 | #148 | Excellent 6.0% |
| Immigrants | Albania | 81.5 /100 | #149 | Excellent 6.1% |
| Zimbabweans | 80.7 /100 | #150 | Excellent 6.1% |
| Immigrants | Southern Europe | 80.5 /100 | #151 | Excellent 6.1% |
| Pakistanis | 79.2 /100 | #152 | Good 6.1% |
| Immigrants | Brazil | 78.9 /100 | #153 | Good 6.1% |
| Immigrants | Philippines | 78.5 /100 | #154 | Good 6.1% |
| Whites/Caucasians | 76.5 /100 | #155 | Good 6.1% |
| Native Hawaiians | 75.0 /100 | #156 | Good 6.1% |
| Chileans | 74.2 /100 | #157 | Good 6.1% |