Bolivian vs Immigrants from Pakistan Single Mother Households
COMPARE
Bolivian
Immigrants from Pakistan
Single Mother Households
Single Mother Households Comparison
Bolivians
Immigrants from Pakistan
5.8%
SINGLE MOTHER HOUSEHOLDS
94.6/ 100
METRIC RATING
117th/ 347
METRIC RANK
6.0%
SINGLE MOTHER HOUSEHOLDS
88.4/ 100
METRIC RATING
137th/ 347
METRIC RANK
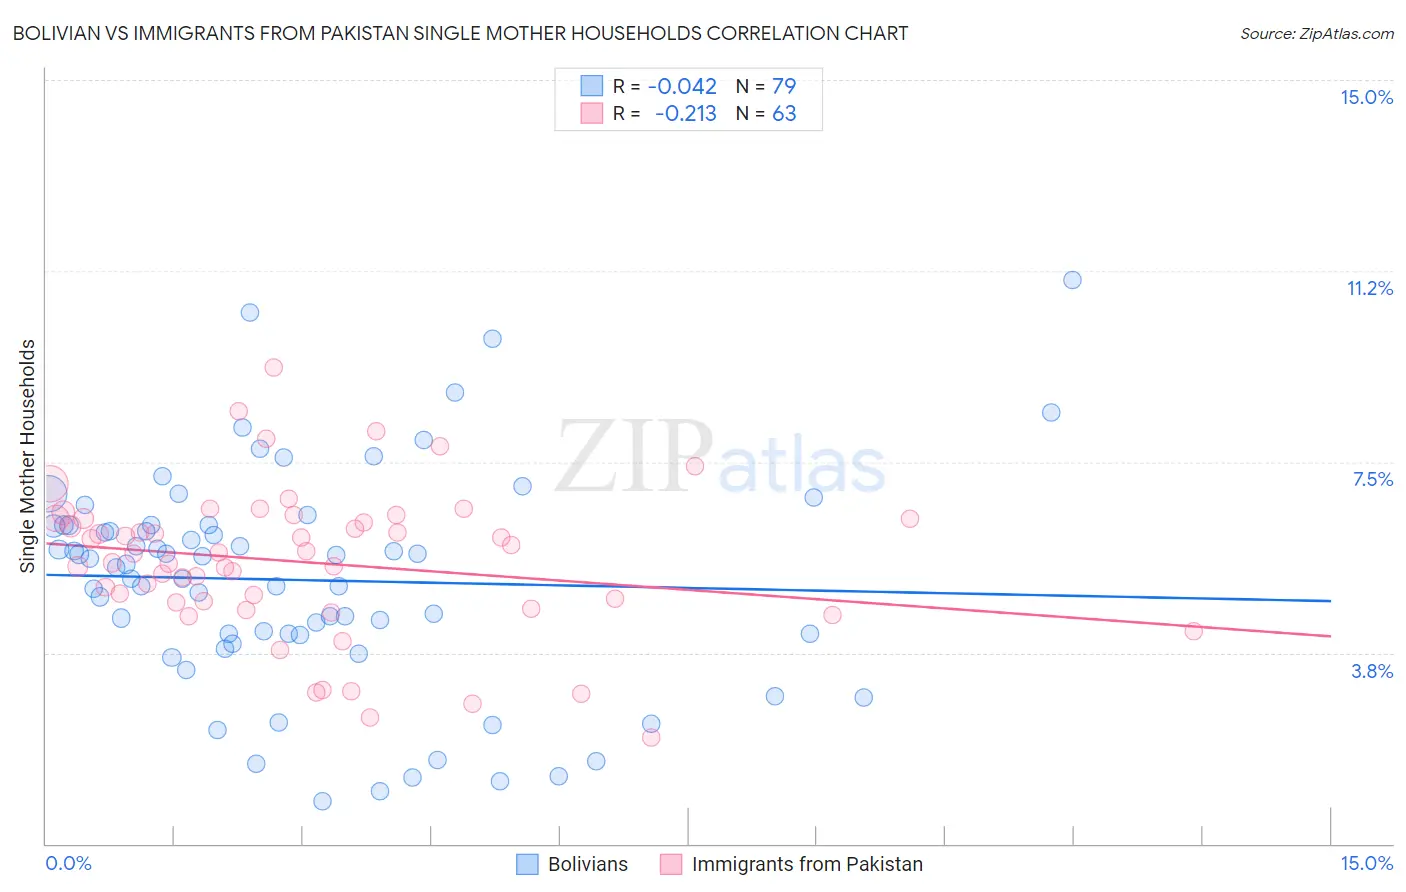
Bolivian vs Immigrants from Pakistan Single Mother Households Correlation Chart
The statistical analysis conducted on geographies consisting of 184,505,456 people shows no correlation between the proportion of Bolivians and percentage of single mother households in the United States with a correlation coefficient (R) of -0.042 and weighted average of 5.8%. Similarly, the statistical analysis conducted on geographies consisting of 283,504,860 people shows a weak negative correlation between the proportion of Immigrants from Pakistan and percentage of single mother households in the United States with a correlation coefficient (R) of -0.213 and weighted average of 6.0%, a difference of 2.5%.
Single Mother Households Correlation Summary
| Measurement | Bolivian | Immigrants from Pakistan |
| Minimum | 0.85% | 2.1% |
| Maximum | 11.1% | 9.4% |
| Range | 10.2% | 7.3% |
| Mean | 5.2% | 5.5% |
| Median | 5.5% | 5.7% |
| Interquartile 25% (IQ1) | 4.1% | 4.7% |
| Interquartile 75% (IQ3) | 6.3% | 6.4% |
| Interquartile Range (IQR) | 2.1% | 1.7% |
| Standard Deviation (Sample) | 2.1% | 1.5% |
| Standard Deviation (Population) | 2.1% | 1.4% |
Demographics Similar to Bolivians and Immigrants from Pakistan by Single Mother Households
In terms of single mother households, the demographic groups most similar to Bolivians are Laotian (5.8%, a difference of 0.18%), South African (5.8%, a difference of 0.28%), Tongan (5.8%, a difference of 0.48%), Argentinean (5.8%, a difference of 0.50%), and Belgian (5.8%, a difference of 0.58%). Similarly, the demographic groups most similar to Immigrants from Pakistan are Jordanian (6.0%, a difference of 0.13%), Immigrants from Saudi Arabia (5.9%, a difference of 0.55%), Canadian (5.9%, a difference of 0.64%), Egyptian (5.9%, a difference of 0.70%), and Albanian (5.9%, a difference of 0.86%).
| Demographics | Rating | Rank | Single Mother Households |
| Bolivians | 94.6 /100 | #117 | Exceptional 5.8% |
| Laotians | 94.3 /100 | #118 | Exceptional 5.8% |
| South Africans | 94.1 /100 | #119 | Exceptional 5.8% |
| Tongans | 93.7 /100 | #120 | Exceptional 5.8% |
| Argentineans | 93.7 /100 | #121 | Exceptional 5.8% |
| Belgians | 93.5 /100 | #122 | Exceptional 5.8% |
| Immigrants | Uzbekistan | 93.4 /100 | #123 | Exceptional 5.9% |
| Immigrants | Argentina | 93.2 /100 | #124 | Exceptional 5.9% |
| Slavs | 92.9 /100 | #125 | Exceptional 5.9% |
| Welsh | 92.8 /100 | #126 | Exceptional 5.9% |
| Lebanese | 92.4 /100 | #127 | Exceptional 5.9% |
| Czechoslovakians | 92.2 /100 | #128 | Exceptional 5.9% |
| Immigrants | Bolivia | 92.2 /100 | #129 | Exceptional 5.9% |
| Palestinians | 92.1 /100 | #130 | Exceptional 5.9% |
| Immigrants | Spain | 91.2 /100 | #131 | Exceptional 5.9% |
| Albanians | 91.1 /100 | #132 | Exceptional 5.9% |
| Egyptians | 90.7 /100 | #133 | Exceptional 5.9% |
| Canadians | 90.5 /100 | #134 | Exceptional 5.9% |
| Immigrants | Saudi Arabia | 90.2 /100 | #135 | Exceptional 5.9% |
| Jordanians | 88.9 /100 | #136 | Excellent 6.0% |
| Immigrants | Pakistan | 88.4 /100 | #137 | Excellent 6.0% |