Colombian vs Delaware Single Father Households
COMPARE
Colombian
Delaware
Single Father Households
Single Father Households Comparison
Colombians
Delaware
2.3%
SINGLE FATHER HOUSEHOLDS
48.0/ 100
METRIC RATING
177th/ 347
METRIC RANK
2.5%
SINGLE FATHER HOUSEHOLDS
2.5/ 100
METRIC RATING
247th/ 347
METRIC RANK
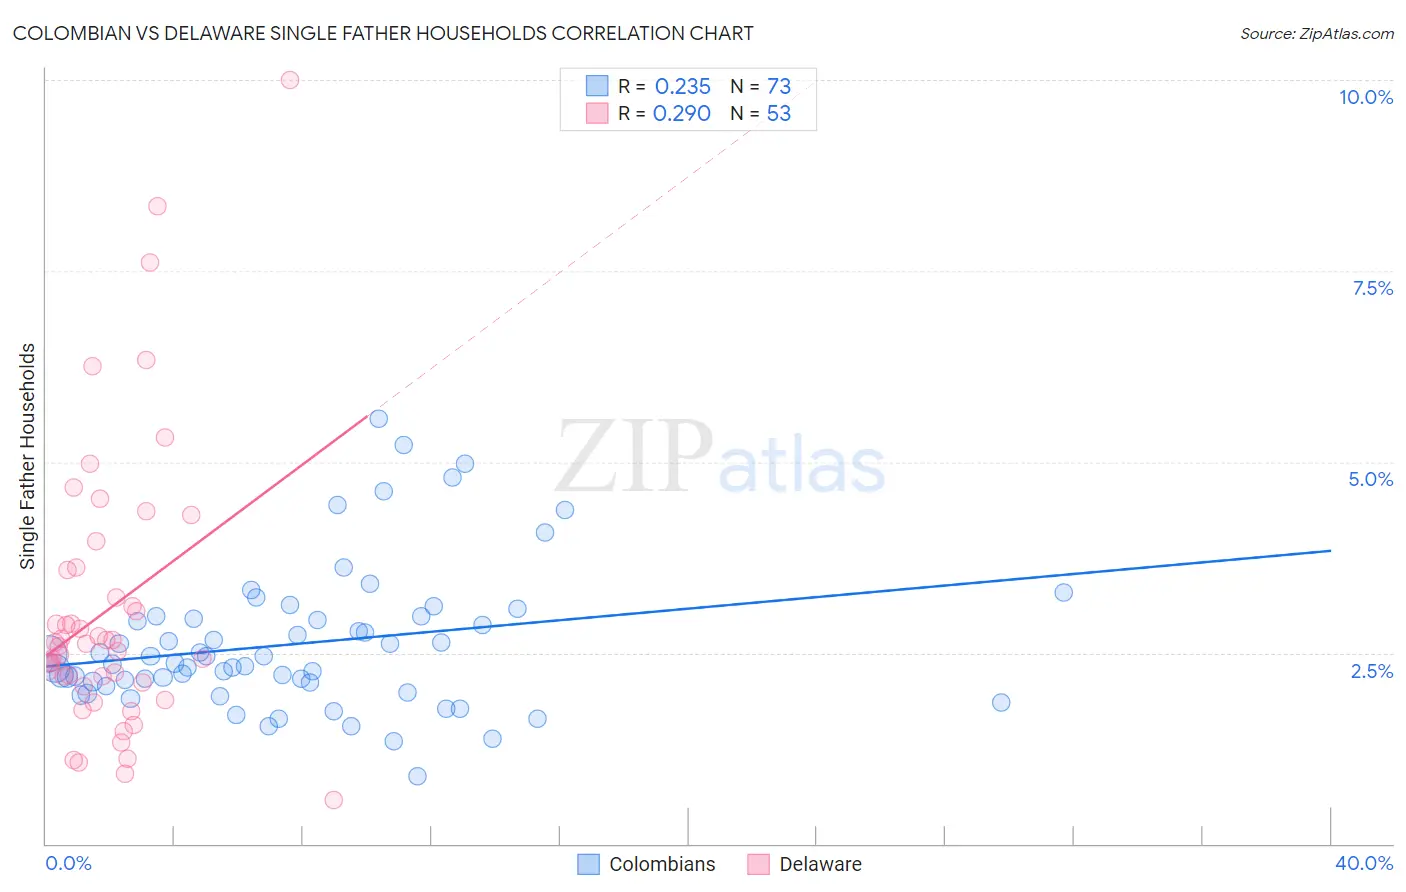
Colombian vs Delaware Single Father Households Correlation Chart
The statistical analysis conducted on geographies consisting of 415,821,309 people shows a weak positive correlation between the proportion of Colombians and percentage of single father households in the United States with a correlation coefficient (R) of 0.235 and weighted average of 2.3%. Similarly, the statistical analysis conducted on geographies consisting of 95,939,857 people shows a weak positive correlation between the proportion of Delaware and percentage of single father households in the United States with a correlation coefficient (R) of 0.290 and weighted average of 2.5%, a difference of 6.6%.
Single Father Households Correlation Summary
| Measurement | Colombian | Delaware |
| Minimum | 0.89% | 0.57% |
| Maximum | 5.6% | 10.0% |
| Range | 4.7% | 9.4% |
| Mean | 2.6% | 3.1% |
| Median | 2.4% | 2.6% |
| Interquartile 25% (IQ1) | 2.1% | 2.1% |
| Interquartile 75% (IQ3) | 3.0% | 3.6% |
| Interquartile Range (IQR) | 0.87% | 1.5% |
| Standard Deviation (Sample) | 0.93% | 1.9% |
| Standard Deviation (Population) | 0.92% | 1.9% |
Similar Demographics by Single Father Households
Demographics Similar to Colombians by Single Father Households
In terms of single father households, the demographic groups most similar to Colombians are Danish (2.3%, a difference of 0.010%), Immigrants from Jamaica (2.3%, a difference of 0.080%), Afghan (2.3%, a difference of 0.14%), Costa Rican (2.3%, a difference of 0.29%), and Welsh (2.3%, a difference of 0.30%).
| Demographics | Rating | Rank | Single Father Households |
| Ugandans | 62.2 /100 | #170 | Good 2.3% |
| Swedes | 61.6 /100 | #171 | Good 2.3% |
| Czechoslovakians | 58.9 /100 | #172 | Average 2.3% |
| Celtics | 55.4 /100 | #173 | Average 2.3% |
| Afghans | 50.0 /100 | #174 | Average 2.3% |
| Immigrants | Jamaica | 49.1 /100 | #175 | Average 2.3% |
| Danes | 48.2 /100 | #176 | Average 2.3% |
| Colombians | 48.0 /100 | #177 | Average 2.3% |
| Costa Ricans | 44.1 /100 | #178 | Average 2.3% |
| Welsh | 44.0 /100 | #179 | Average 2.3% |
| Yugoslavians | 43.9 /100 | #180 | Average 2.3% |
| Jamaicans | 43.5 /100 | #181 | Average 2.3% |
| Belgians | 43.3 /100 | #182 | Average 2.3% |
| Immigrants | Panama | 41.8 /100 | #183 | Average 2.4% |
| Sri Lankans | 41.8 /100 | #184 | Average 2.4% |
Demographics Similar to Delaware by Single Father Households
In terms of single father households, the demographic groups most similar to Delaware are Native Hawaiian (2.5%, a difference of 0.020%), Basque (2.5%, a difference of 0.030%), Bahamian (2.5%, a difference of 0.040%), Immigrants from Cameroon (2.5%, a difference of 0.13%), and Immigrants from Middle Africa (2.5%, a difference of 0.24%).
| Demographics | Rating | Rank | Single Father Households |
| Immigrants | Dominica | 4.8 /100 | #240 | Tragic 2.5% |
| Portuguese | 4.1 /100 | #241 | Tragic 2.5% |
| Osage | 4.1 /100 | #242 | Tragic 2.5% |
| Spaniards | 3.1 /100 | #243 | Tragic 2.5% |
| Immigrants | Middle Africa | 2.8 /100 | #244 | Tragic 2.5% |
| Basques | 2.5 /100 | #245 | Tragic 2.5% |
| Native Hawaiians | 2.5 /100 | #246 | Tragic 2.5% |
| Delaware | 2.5 /100 | #247 | Tragic 2.5% |
| Bahamians | 2.4 /100 | #248 | Tragic 2.5% |
| Immigrants | Cameroon | 2.3 /100 | #249 | Tragic 2.5% |
| Somalis | 2.1 /100 | #250 | Tragic 2.5% |
| Liberians | 2.0 /100 | #251 | Tragic 2.5% |
| Immigrants | Eritrea | 2.0 /100 | #252 | Tragic 2.5% |
| Immigrants | Somalia | 1.9 /100 | #253 | Tragic 2.5% |
| Immigrants | Thailand | 1.8 /100 | #254 | Tragic 2.5% |