Italian vs Delaware Single Father Households
COMPARE
Italian
Delaware
Single Father Households
Single Father Households Comparison
Italians
Delaware
2.2%
SINGLE FATHER HOUSEHOLDS
98.3/ 100
METRIC RATING
110th/ 347
METRIC RANK
2.5%
SINGLE FATHER HOUSEHOLDS
2.5/ 100
METRIC RATING
247th/ 347
METRIC RANK
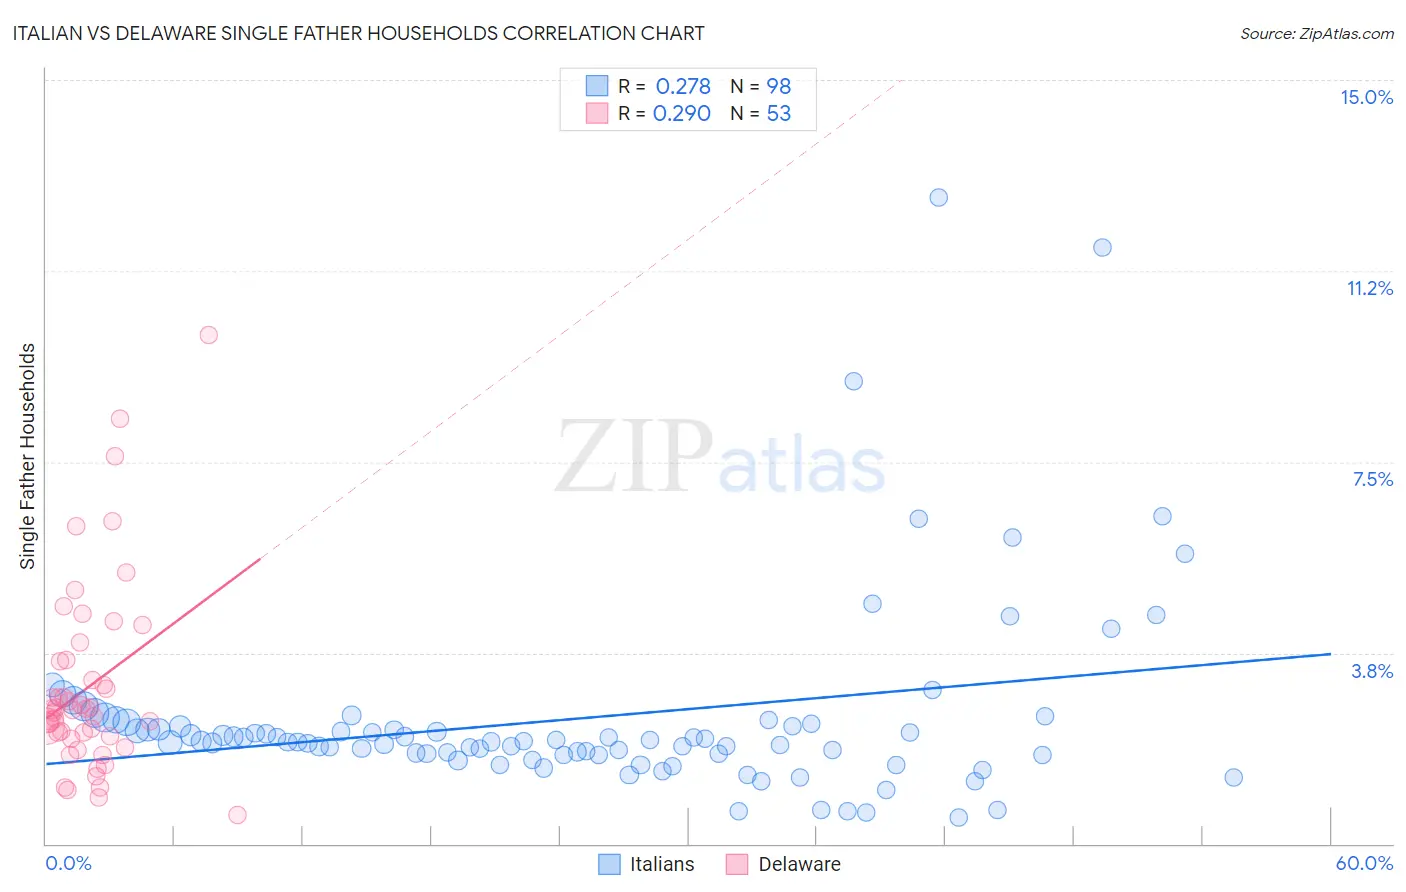
Italian vs Delaware Single Father Households Correlation Chart
The statistical analysis conducted on geographies consisting of 559,287,230 people shows a weak positive correlation between the proportion of Italians and percentage of single father households in the United States with a correlation coefficient (R) of 0.278 and weighted average of 2.2%. Similarly, the statistical analysis conducted on geographies consisting of 95,939,857 people shows a weak positive correlation between the proportion of Delaware and percentage of single father households in the United States with a correlation coefficient (R) of 0.290 and weighted average of 2.5%, a difference of 15.4%.
Single Father Households Correlation Summary
| Measurement | Italian | Delaware |
| Minimum | 0.51% | 0.57% |
| Maximum | 12.7% | 10.0% |
| Range | 12.2% | 9.4% |
| Mean | 2.5% | 3.1% |
| Median | 2.0% | 2.6% |
| Interquartile 25% (IQ1) | 1.8% | 2.1% |
| Interquartile 75% (IQ3) | 2.3% | 3.6% |
| Interquartile Range (IQR) | 0.56% | 1.5% |
| Standard Deviation (Sample) | 1.9% | 1.9% |
| Standard Deviation (Population) | 1.9% | 1.9% |
Similar Demographics by Single Father Households
Demographics Similar to Italians by Single Father Households
In terms of single father households, the demographic groups most similar to Italians are Immigrants from Canada (2.2%, a difference of 0.080%), Immigrants from Trinidad and Tobago (2.2%, a difference of 0.12%), Barbadian (2.2%, a difference of 0.13%), Iraqi (2.2%, a difference of 0.13%), and Immigrants from Netherlands (2.2%, a difference of 0.16%).
| Demographics | Rating | Rank | Single Father Households |
| Lebanese | 98.9 /100 | #103 | Exceptional 2.1% |
| Alsatians | 98.9 /100 | #104 | Exceptional 2.1% |
| Palestinians | 98.6 /100 | #105 | Exceptional 2.2% |
| Immigrants | Southern Europe | 98.6 /100 | #106 | Exceptional 2.2% |
| Slovenes | 98.5 /100 | #107 | Exceptional 2.2% |
| Immigrants | Netherlands | 98.5 /100 | #108 | Exceptional 2.2% |
| Barbadians | 98.4 /100 | #109 | Exceptional 2.2% |
| Italians | 98.3 /100 | #110 | Exceptional 2.2% |
| Immigrants | Canada | 98.3 /100 | #111 | Exceptional 2.2% |
| Immigrants | Trinidad and Tobago | 98.2 /100 | #112 | Exceptional 2.2% |
| Iraqis | 98.2 /100 | #113 | Exceptional 2.2% |
| Immigrants | North America | 98.2 /100 | #114 | Exceptional 2.2% |
| Immigrants | Barbados | 98.2 /100 | #115 | Exceptional 2.2% |
| Immigrants | Argentina | 98.1 /100 | #116 | Exceptional 2.2% |
| Hungarians | 97.9 /100 | #117 | Exceptional 2.2% |
Demographics Similar to Delaware by Single Father Households
In terms of single father households, the demographic groups most similar to Delaware are Native Hawaiian (2.5%, a difference of 0.020%), Basque (2.5%, a difference of 0.030%), Bahamian (2.5%, a difference of 0.040%), Immigrants from Cameroon (2.5%, a difference of 0.13%), and Immigrants from Middle Africa (2.5%, a difference of 0.24%).
| Demographics | Rating | Rank | Single Father Households |
| Immigrants | Dominica | 4.8 /100 | #240 | Tragic 2.5% |
| Portuguese | 4.1 /100 | #241 | Tragic 2.5% |
| Osage | 4.1 /100 | #242 | Tragic 2.5% |
| Spaniards | 3.1 /100 | #243 | Tragic 2.5% |
| Immigrants | Middle Africa | 2.8 /100 | #244 | Tragic 2.5% |
| Basques | 2.5 /100 | #245 | Tragic 2.5% |
| Native Hawaiians | 2.5 /100 | #246 | Tragic 2.5% |
| Delaware | 2.5 /100 | #247 | Tragic 2.5% |
| Bahamians | 2.4 /100 | #248 | Tragic 2.5% |
| Immigrants | Cameroon | 2.3 /100 | #249 | Tragic 2.5% |
| Somalis | 2.1 /100 | #250 | Tragic 2.5% |
| Liberians | 2.0 /100 | #251 | Tragic 2.5% |
| Immigrants | Eritrea | 2.0 /100 | #252 | Tragic 2.5% |
| Immigrants | Somalia | 1.9 /100 | #253 | Tragic 2.5% |
| Immigrants | Thailand | 1.8 /100 | #254 | Tragic 2.5% |