Yuman vs British West Indian Disability Age 18 to 34
COMPARE
Yuman
British West Indian
Disability Age 18 to 34
Disability Age 18 to 34 Comparison
Yuman
British West Indians
10.6%
DISABILITY AGE 18 TO 34
0.0/ 100
METRIC RATING
347th/ 347
METRIC RANK
6.0%
DISABILITY AGE 18 TO 34
99.6/ 100
METRIC RATING
61st/ 347
METRIC RANK
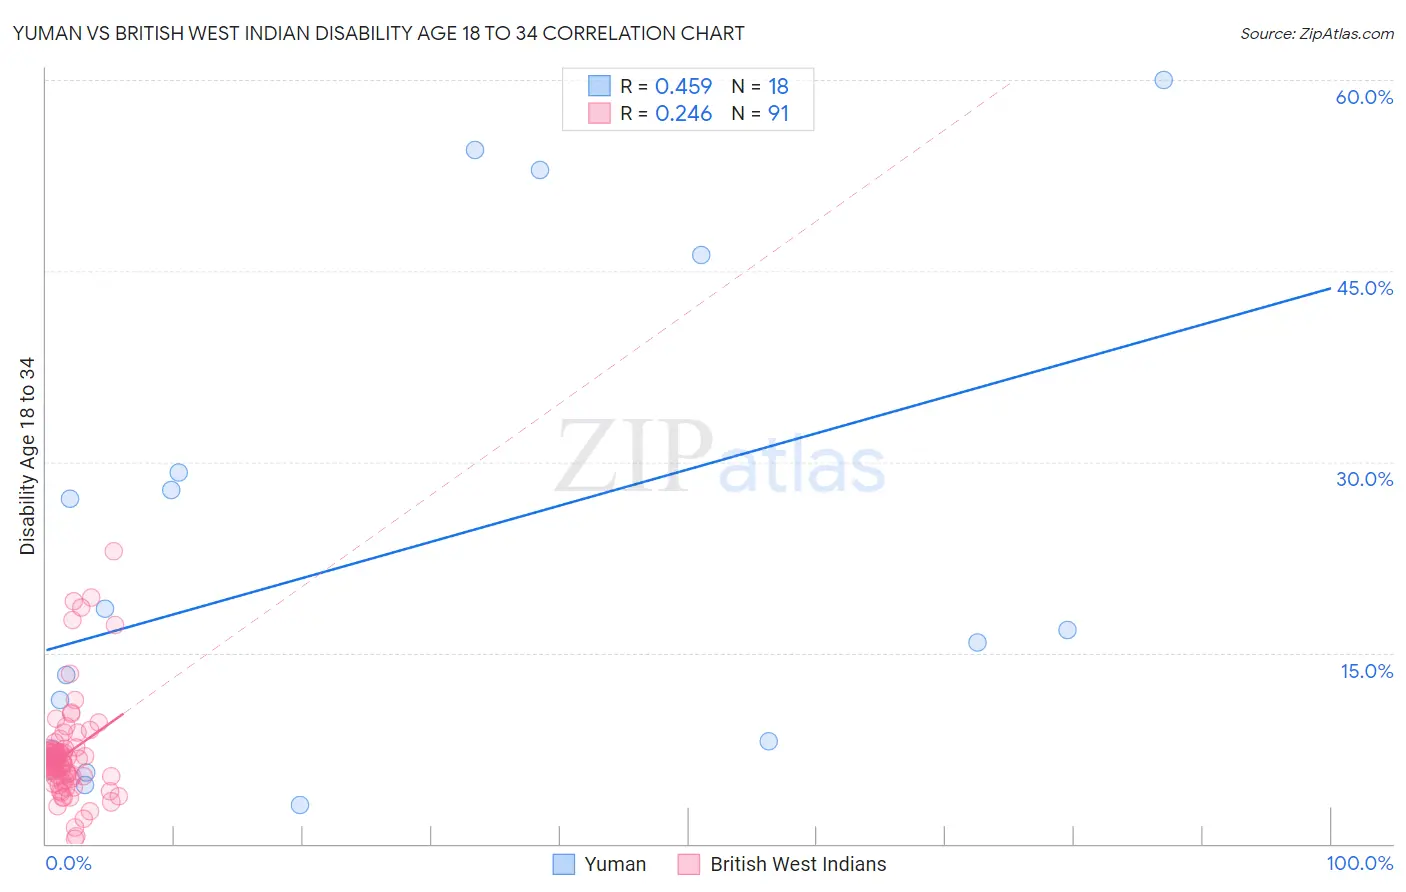
Yuman vs British West Indian Disability Age 18 to 34 Correlation Chart
The statistical analysis conducted on geographies consisting of 40,657,868 people shows a moderate positive correlation between the proportion of Yuman and percentage of population with a disability between the ages 18 and 35 in the United States with a correlation coefficient (R) of 0.459 and weighted average of 10.6%. Similarly, the statistical analysis conducted on geographies consisting of 152,620,566 people shows a weak positive correlation between the proportion of British West Indians and percentage of population with a disability between the ages 18 and 35 in the United States with a correlation coefficient (R) of 0.246 and weighted average of 6.0%, a difference of 76.8%.
Disability Age 18 to 34 Correlation Summary
| Measurement | Yuman | British West Indian |
| Minimum | 3.0% | 0.44% |
| Maximum | 60.0% | 23.0% |
| Range | 57.0% | 22.5% |
| Mean | 22.7% | 7.0% |
| Median | 16.3% | 6.5% |
| Interquartile 25% (IQ1) | 7.4% | 5.3% |
| Interquartile 75% (IQ3) | 29.2% | 7.3% |
| Interquartile Range (IQR) | 21.8% | 2.0% |
| Standard Deviation (Sample) | 18.8% | 3.9% |
| Standard Deviation (Population) | 18.3% | 3.8% |
Similar Demographics by Disability Age 18 to 34
Demographics Similar to Yuman by Disability Age 18 to 34
In terms of disability age 18 to 34, the demographic groups most similar to Yuman are Houma (9.7%, a difference of 8.9%), Alaskan Athabascan (9.4%, a difference of 11.8%), Creek (9.0%, a difference of 17.1%), Chippewa (9.0%, a difference of 17.6%), and Yakama (9.0%, a difference of 17.6%).
| Demographics | Rating | Rank | Disability Age 18 to 34 |
| Apache | 0.0 /100 | #333 | Tragic 8.4% |
| Dutch West Indians | 0.0 /100 | #334 | Tragic 8.4% |
| Seminole | 0.0 /100 | #335 | Tragic 8.4% |
| Immigrants | Azores | 0.0 /100 | #336 | Tragic 8.5% |
| Ottawa | 0.0 /100 | #337 | Tragic 8.6% |
| Cherokee | 0.0 /100 | #338 | Tragic 8.7% |
| Kiowa | 0.0 /100 | #339 | Tragic 8.8% |
| Choctaw | 0.0 /100 | #340 | Tragic 9.0% |
| Chickasaw | 0.0 /100 | #341 | Tragic 9.0% |
| Yakama | 0.0 /100 | #342 | Tragic 9.0% |
| Chippewa | 0.0 /100 | #343 | Tragic 9.0% |
| Creek | 0.0 /100 | #344 | Tragic 9.0% |
| Alaskan Athabascans | 0.0 /100 | #345 | Tragic 9.4% |
| Houma | 0.0 /100 | #346 | Tragic 9.7% |
| Yuman | 0.0 /100 | #347 | Tragic 10.6% |
Demographics Similar to British West Indians by Disability Age 18 to 34
In terms of disability age 18 to 34, the demographic groups most similar to British West Indians are Peruvian (6.0%, a difference of 0.030%), Salvadoran (6.0%, a difference of 0.080%), Taiwanese (6.0%, a difference of 0.090%), Trinidadian and Tobagonian (6.0%, a difference of 0.23%), and Immigrants from Caribbean (6.0%, a difference of 0.26%).
| Demographics | Rating | Rank | Disability Age 18 to 34 |
| Immigrants | Malaysia | 99.7 /100 | #54 | Exceptional 5.9% |
| Immigrants | Spain | 99.7 /100 | #55 | Exceptional 5.9% |
| Paraguayans | 99.7 /100 | #56 | Exceptional 5.9% |
| Immigrants | Haiti | 99.7 /100 | #57 | Exceptional 5.9% |
| Immigrants | Serbia | 99.7 /100 | #58 | Exceptional 5.9% |
| Immigrants | Caribbean | 99.6 /100 | #59 | Exceptional 6.0% |
| Immigrants | Sri Lanka | 99.6 /100 | #60 | Exceptional 6.0% |
| British West Indians | 99.6 /100 | #61 | Exceptional 6.0% |
| Peruvians | 99.6 /100 | #62 | Exceptional 6.0% |
| Salvadorans | 99.6 /100 | #63 | Exceptional 6.0% |
| Taiwanese | 99.6 /100 | #64 | Exceptional 6.0% |
| Trinidadians and Tobagonians | 99.5 /100 | #65 | Exceptional 6.0% |
| Burmese | 99.5 /100 | #66 | Exceptional 6.0% |
| Immigrants | North Macedonia | 99.5 /100 | #67 | Exceptional 6.0% |
| Immigrants | Poland | 99.5 /100 | #68 | Exceptional 6.0% |