Immigrants from Senegal vs British West Indian Currently Married
COMPARE
Immigrants from Senegal
British West Indian
Currently Married
Currently Married Comparison
Immigrants from Senegal
British West Indians
40.7%
CURRENTLY MARRIED
0.0/ 100
METRIC RATING
324th/ 347
METRIC RANK
39.8%
CURRENTLY MARRIED
0.0/ 100
METRIC RATING
336th/ 347
METRIC RANK
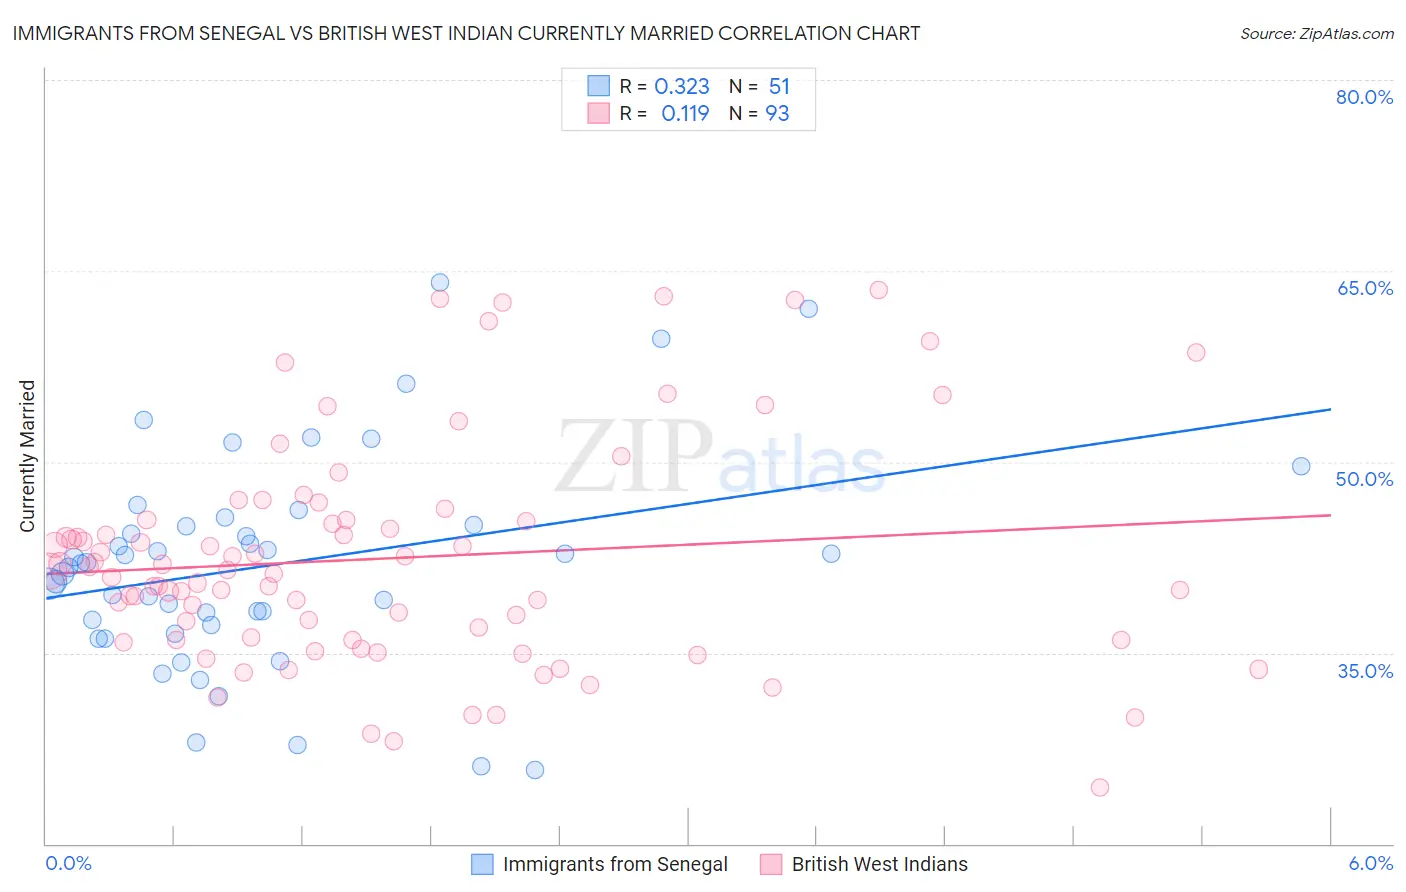
Immigrants from Senegal vs British West Indian Currently Married Correlation Chart
The statistical analysis conducted on geographies consisting of 90,127,337 people shows a mild positive correlation between the proportion of Immigrants from Senegal and percentage of population currently married in the United States with a correlation coefficient (R) of 0.323 and weighted average of 40.7%. Similarly, the statistical analysis conducted on geographies consisting of 152,687,142 people shows a poor positive correlation between the proportion of British West Indians and percentage of population currently married in the United States with a correlation coefficient (R) of 0.119 and weighted average of 39.8%, a difference of 2.4%.
Currently Married Correlation Summary
| Measurement | Immigrants from Senegal | British West Indian |
| Minimum | 25.8% | 24.4% |
| Maximum | 64.1% | 63.5% |
| Range | 38.3% | 39.1% |
| Mean | 41.9% | 42.4% |
| Median | 42.0% | 41.4% |
| Interquartile 25% (IQ1) | 37.2% | 36.0% |
| Interquartile 75% (IQ3) | 45.0% | 45.4% |
| Interquartile Range (IQR) | 7.8% | 9.4% |
| Standard Deviation (Sample) | 8.3% | 8.7% |
| Standard Deviation (Population) | 8.3% | 8.7% |
Demographics Similar to Immigrants from Senegal and British West Indians by Currently Married
In terms of currently married, the demographic groups most similar to Immigrants from Senegal are Immigrants from West Indies (40.7%, a difference of 0.010%), U.S. Virgin Islander (40.7%, a difference of 0.050%), Barbadian (40.6%, a difference of 0.19%), Senegalese (40.6%, a difference of 0.36%), and Arapaho (40.5%, a difference of 0.40%). Similarly, the demographic groups most similar to British West Indians are Lumbee (39.8%, a difference of 0.18%), Puerto Rican (39.9%, a difference of 0.34%), Yup'ik (39.9%, a difference of 0.35%), Black/African American (39.6%, a difference of 0.38%), and Cape Verdean (39.6%, a difference of 0.47%).
| Demographics | Rating | Rank | Currently Married |
| Immigrants | Jamaica | 0.0 /100 | #320 | Tragic 41.1% |
| Immigrants | Congo | 0.0 /100 | #321 | Tragic 41.1% |
| Immigrants | Haiti | 0.0 /100 | #322 | Tragic 41.0% |
| Immigrants | West Indies | 0.0 /100 | #323 | Tragic 40.7% |
| Immigrants | Senegal | 0.0 /100 | #324 | Tragic 40.7% |
| U.S. Virgin Islanders | 0.0 /100 | #325 | Tragic 40.7% |
| Barbadians | 0.0 /100 | #326 | Tragic 40.6% |
| Senegalese | 0.0 /100 | #327 | Tragic 40.6% |
| Arapaho | 0.0 /100 | #328 | Tragic 40.5% |
| Crow | 0.0 /100 | #329 | Tragic 40.4% |
| Immigrants | Dominica | 0.0 /100 | #330 | Tragic 40.3% |
| Immigrants | Barbados | 0.0 /100 | #331 | Tragic 40.3% |
| Immigrants | St. Vincent and the Grenadines | 0.0 /100 | #332 | Tragic 40.1% |
| Yup'ik | 0.0 /100 | #333 | Tragic 39.9% |
| Puerto Ricans | 0.0 /100 | #334 | Tragic 39.9% |
| Lumbee | 0.0 /100 | #335 | Tragic 39.8% |
| British West Indians | 0.0 /100 | #336 | Tragic 39.8% |
| Blacks/African Americans | 0.0 /100 | #337 | Tragic 39.6% |
| Cape Verdeans | 0.0 /100 | #338 | Tragic 39.6% |
| Dominicans | 0.0 /100 | #339 | Tragic 39.5% |
| Immigrants | Grenada | 0.0 /100 | #340 | Tragic 39.1% |