Sri Lankan vs Japanese Single Father Households
COMPARE
Sri Lankan
Japanese
Single Father Households
Single Father Households Comparison
Sri Lankans
Japanese
2.4%
SINGLE FATHER HOUSEHOLDS
41.8/ 100
METRIC RATING
184th/ 347
METRIC RANK
2.8%
SINGLE FATHER HOUSEHOLDS
0.0/ 100
METRIC RATING
296th/ 347
METRIC RANK
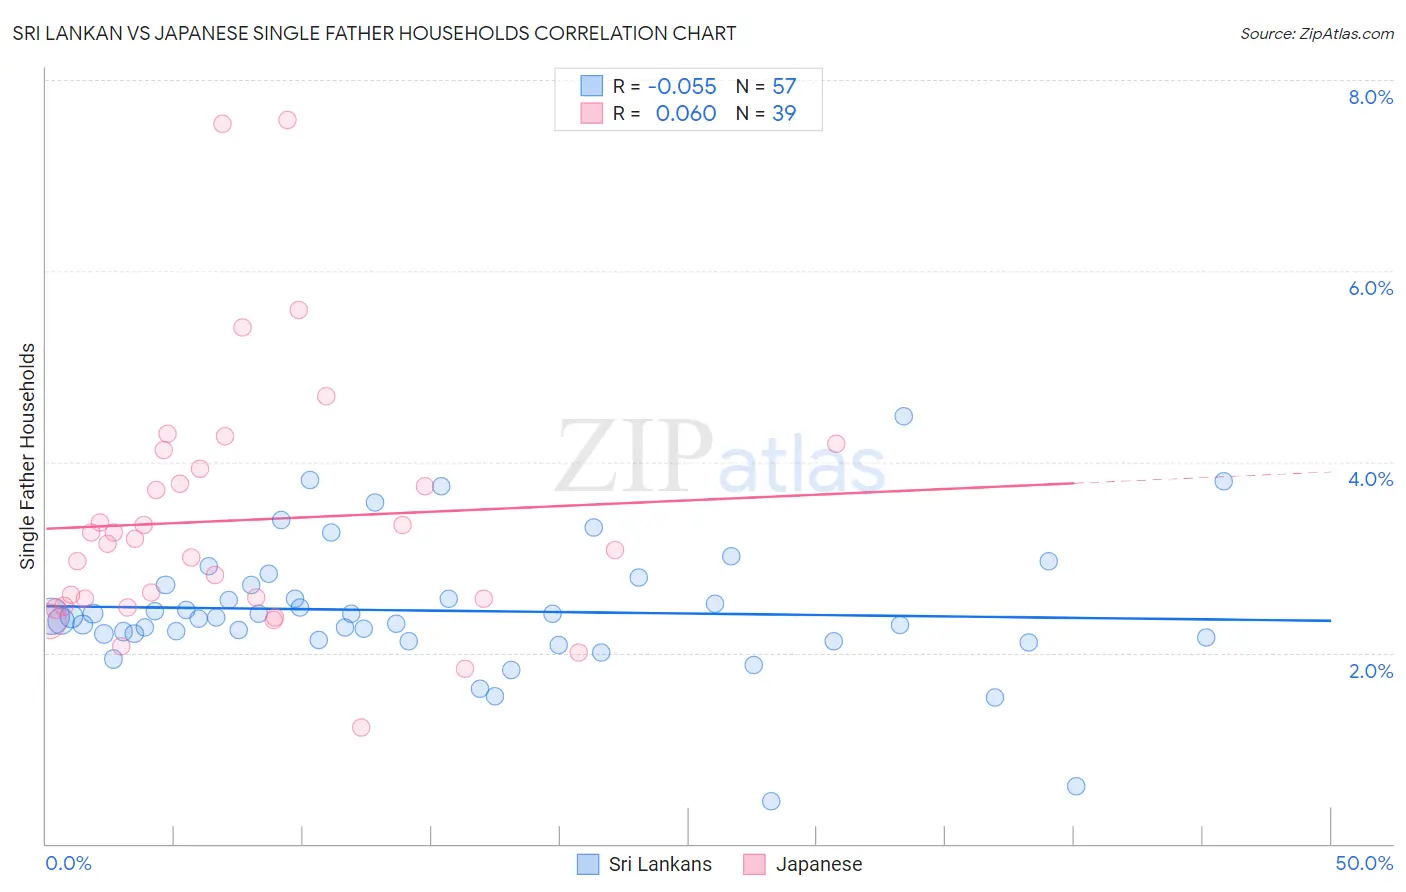
Sri Lankan vs Japanese Single Father Households Correlation Chart
The statistical analysis conducted on geographies consisting of 436,338,437 people shows a slight negative correlation between the proportion of Sri Lankans and percentage of single father households in the United States with a correlation coefficient (R) of -0.055 and weighted average of 2.4%. Similarly, the statistical analysis conducted on geographies consisting of 248,286,499 people shows a slight positive correlation between the proportion of Japanese and percentage of single father households in the United States with a correlation coefficient (R) of 0.060 and weighted average of 2.8%, a difference of 17.0%.
Single Father Households Correlation Summary
| Measurement | Sri Lankan | Japanese |
| Minimum | 0.45% | 1.2% |
| Maximum | 4.5% | 7.6% |
| Range | 4.0% | 6.4% |
| Mean | 2.4% | 3.4% |
| Median | 2.4% | 3.1% |
| Interquartile 25% (IQ1) | 2.1% | 2.5% |
| Interquartile 75% (IQ3) | 2.7% | 3.9% |
| Interquartile Range (IQR) | 0.56% | 1.4% |
| Standard Deviation (Sample) | 0.69% | 1.4% |
| Standard Deviation (Population) | 0.68% | 1.3% |
Similar Demographics by Single Father Households
Demographics Similar to Sri Lankans by Single Father Households
In terms of single father households, the demographic groups most similar to Sri Lankans are Immigrants from Panama (2.4%, a difference of 0.0%), Nigerian (2.4%, a difference of 0.060%), Immigrants from Bosnia and Herzegovina (2.4%, a difference of 0.10%), Belgian (2.3%, a difference of 0.11%), and Jamaican (2.3%, a difference of 0.13%).
| Demographics | Rating | Rank | Single Father Households |
| Colombians | 48.0 /100 | #177 | Average 2.3% |
| Costa Ricans | 44.1 /100 | #178 | Average 2.3% |
| Welsh | 44.0 /100 | #179 | Average 2.3% |
| Yugoslavians | 43.9 /100 | #180 | Average 2.3% |
| Jamaicans | 43.5 /100 | #181 | Average 2.3% |
| Belgians | 43.3 /100 | #182 | Average 2.3% |
| Immigrants | Panama | 41.8 /100 | #183 | Average 2.4% |
| Sri Lankans | 41.8 /100 | #184 | Average 2.4% |
| Nigerians | 41.0 /100 | #185 | Average 2.4% |
| Immigrants | Bosnia and Herzegovina | 40.4 /100 | #186 | Average 2.4% |
| Immigrants | Colombia | 34.0 /100 | #187 | Fair 2.4% |
| Hmong | 33.0 /100 | #188 | Fair 2.4% |
| U.S. Virgin Islanders | 31.8 /100 | #189 | Fair 2.4% |
| French | 31.7 /100 | #190 | Fair 2.4% |
| Immigrants | Africa | 30.0 /100 | #191 | Fair 2.4% |
Demographics Similar to Japanese by Single Father Households
In terms of single father households, the demographic groups most similar to Japanese are Chickasaw (2.8%, a difference of 0.020%), Honduran (2.8%, a difference of 0.080%), Cree (2.8%, a difference of 0.57%), Malaysian (2.7%, a difference of 0.83%), and Lumbee (2.8%, a difference of 0.95%).
| Demographics | Rating | Rank | Single Father Households |
| Tlingit-Haida | 0.0 /100 | #289 | Tragic 2.7% |
| Puget Sound Salish | 0.0 /100 | #290 | Tragic 2.7% |
| Blackfeet | 0.0 /100 | #291 | Tragic 2.7% |
| Choctaw | 0.0 /100 | #292 | Tragic 2.7% |
| Immigrants | Fiji | 0.0 /100 | #293 | Tragic 2.7% |
| Malaysians | 0.0 /100 | #294 | Tragic 2.7% |
| Chickasaw | 0.0 /100 | #295 | Tragic 2.8% |
| Japanese | 0.0 /100 | #296 | Tragic 2.8% |
| Hondurans | 0.0 /100 | #297 | Tragic 2.8% |
| Cree | 0.0 /100 | #298 | Tragic 2.8% |
| Lumbee | 0.0 /100 | #299 | Tragic 2.8% |
| Kiowa | 0.0 /100 | #300 | Tragic 2.8% |
| Immigrants | Latin America | 0.0 /100 | #301 | Tragic 2.8% |
| Spanish Americans | 0.0 /100 | #302 | Tragic 2.8% |
| Immigrants | Honduras | 0.0 /100 | #303 | Tragic 2.8% |