Guyanese vs Immigrants from West Indies Family Households
COMPARE
Guyanese
Immigrants from West Indies
Family Households
Family Households Comparison
Guyanese
Immigrants from West Indies
65.3%
FAMILY HOUSEHOLDS
98.8/ 100
METRIC RATING
93rd/ 347
METRIC RANK
61.6%
FAMILY HOUSEHOLDS
0.0/ 100
METRIC RATING
324th/ 347
METRIC RANK
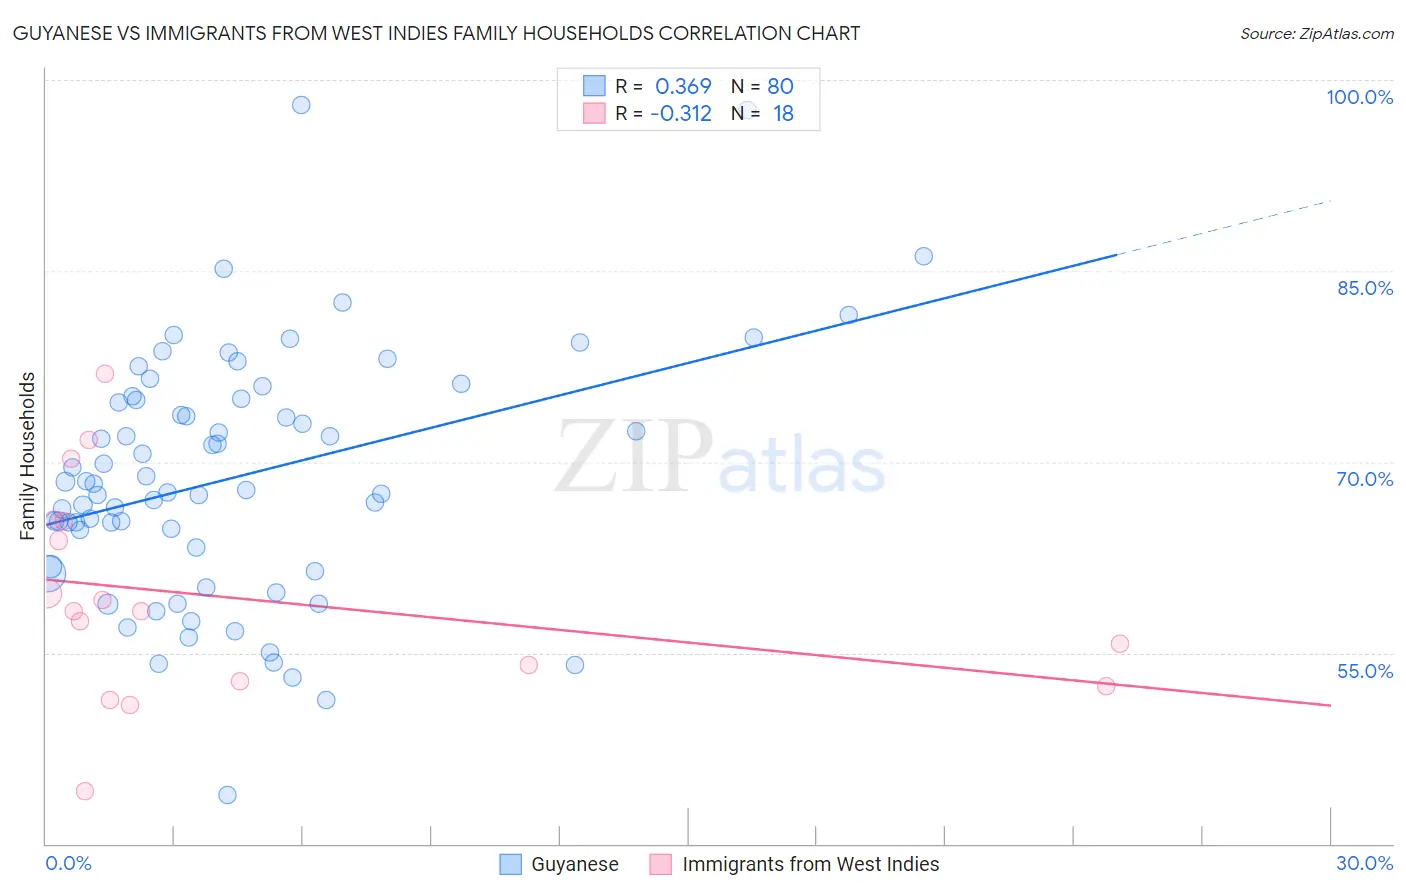
Guyanese vs Immigrants from West Indies Family Households Correlation Chart
The statistical analysis conducted on geographies consisting of 176,801,738 people shows a mild positive correlation between the proportion of Guyanese and percentage of family households in the United States with a correlation coefficient (R) of 0.369 and weighted average of 65.3%. Similarly, the statistical analysis conducted on geographies consisting of 72,452,456 people shows a mild negative correlation between the proportion of Immigrants from West Indies and percentage of family households in the United States with a correlation coefficient (R) of -0.312 and weighted average of 61.6%, a difference of 5.9%.
Family Households Correlation Summary
| Measurement | Guyanese | Immigrants from West Indies |
| Minimum | 43.8% | 44.1% |
| Maximum | 98.1% | 77.0% |
| Range | 54.2% | 32.9% |
| Mean | 68.8% | 59.3% |
| Median | 68.1% | 58.3% |
| Interquartile 25% (IQ1) | 62.5% | 52.8% |
| Interquartile 75% (IQ3) | 74.9% | 65.4% |
| Interquartile Range (IQR) | 12.4% | 12.5% |
| Standard Deviation (Sample) | 9.7% | 8.3% |
| Standard Deviation (Population) | 9.7% | 8.1% |
Similar Demographics by Family Households
Demographics Similar to Guyanese by Family Households
In terms of family households, the demographic groups most similar to Guyanese are Hopi (65.3%, a difference of 0.0%), Immigrants from Poland (65.2%, a difference of 0.020%), Immigrants from Portugal (65.2%, a difference of 0.040%), Crow (65.3%, a difference of 0.050%), and Swiss (65.2%, a difference of 0.050%).
| Demographics | Rating | Rank | Family Households |
| Egyptians | 99.4 /100 | #86 | Exceptional 65.4% |
| Immigrants | Egypt | 99.2 /100 | #87 | Exceptional 65.3% |
| Immigrants | Haiti | 99.1 /100 | #88 | Exceptional 65.3% |
| Immigrants | Caribbean | 99.1 /100 | #89 | Exceptional 65.3% |
| Immigrants | Laos | 99.1 /100 | #90 | Exceptional 65.3% |
| Crow | 98.9 /100 | #91 | Exceptional 65.3% |
| Hopi | 98.8 /100 | #92 | Exceptional 65.3% |
| Guyanese | 98.8 /100 | #93 | Exceptional 65.3% |
| Immigrants | Poland | 98.7 /100 | #94 | Exceptional 65.2% |
| Immigrants | Portugal | 98.6 /100 | #95 | Exceptional 65.2% |
| Swiss | 98.6 /100 | #96 | Exceptional 65.2% |
| Guatemalans | 98.6 /100 | #97 | Exceptional 65.2% |
| Immigrants | Syria | 98.4 /100 | #98 | Exceptional 65.2% |
| Central American Indians | 98.3 /100 | #99 | Exceptional 65.2% |
| Haitians | 98.1 /100 | #100 | Exceptional 65.2% |
Demographics Similar to Immigrants from West Indies by Family Households
In terms of family households, the demographic groups most similar to Immigrants from West Indies are Immigrants from Serbia (61.6%, a difference of 0.010%), Tlingit-Haida (61.6%, a difference of 0.010%), Immigrants from Switzerland (61.6%, a difference of 0.010%), Alsatian (61.7%, a difference of 0.10%), and Ugandan (61.7%, a difference of 0.16%).
| Demographics | Rating | Rank | Family Households |
| Immigrants | Bosnia and Herzegovina | 0.0 /100 | #317 | Tragic 61.9% |
| Alaskan Athabascans | 0.0 /100 | #318 | Tragic 61.8% |
| Cape Verdeans | 0.0 /100 | #319 | Tragic 61.8% |
| Ugandans | 0.0 /100 | #320 | Tragic 61.7% |
| Alsatians | 0.0 /100 | #321 | Tragic 61.7% |
| Immigrants | Serbia | 0.0 /100 | #322 | Tragic 61.6% |
| Tlingit-Haida | 0.0 /100 | #323 | Tragic 61.6% |
| Immigrants | West Indies | 0.0 /100 | #324 | Tragic 61.6% |
| Immigrants | Switzerland | 0.0 /100 | #325 | Tragic 61.6% |
| Indonesians | 0.0 /100 | #326 | Tragic 61.5% |
| Blacks/African Americans | 0.0 /100 | #327 | Tragic 61.5% |
| Kiowa | 0.0 /100 | #328 | Tragic 61.4% |
| Cambodians | 0.0 /100 | #329 | Tragic 61.4% |
| Immigrants | Australia | 0.0 /100 | #330 | Tragic 61.3% |
| Immigrants | France | 0.0 /100 | #331 | Tragic 61.3% |