Soviet Union vs Israeli Divorced or Separated
COMPARE
Soviet Union
Israeli
Divorced or Separated
Divorced or Separated Comparison
Soviet Union
Israelis
11.1%
DIVORCED OR SEPARATED
100.0/ 100
METRIC RATING
40th/ 347
METRIC RANK
11.3%
DIVORCED OR SEPARATED
99.9/ 100
METRIC RATING
59th/ 347
METRIC RANK
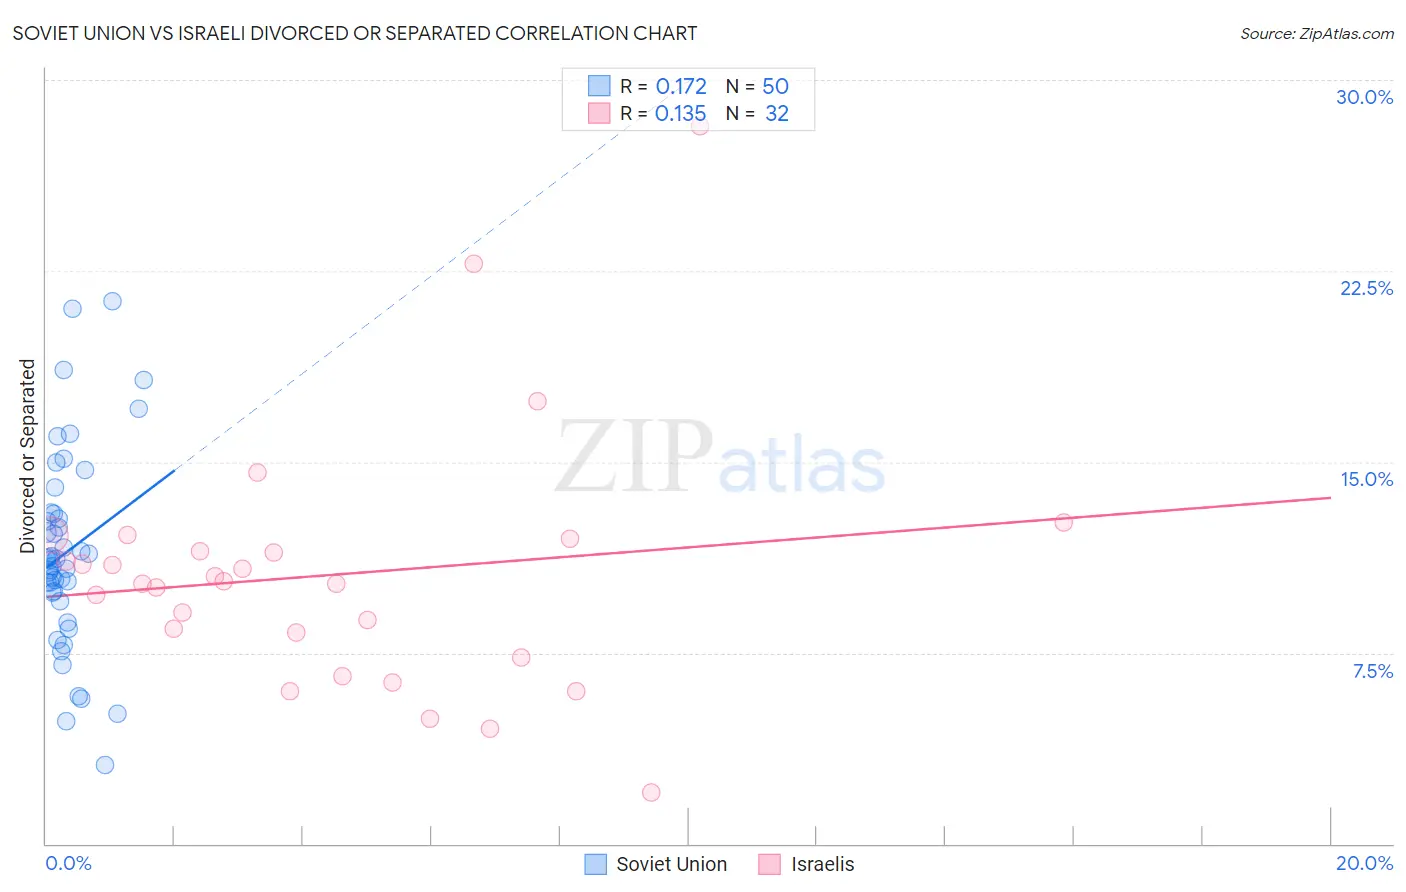
Soviet Union vs Israeli Divorced or Separated Correlation Chart
The statistical analysis conducted on geographies consisting of 43,509,630 people shows a poor positive correlation between the proportion of Soviet Union and percentage of population currently divorced or separated in the United States with a correlation coefficient (R) of 0.172 and weighted average of 11.1%. Similarly, the statistical analysis conducted on geographies consisting of 211,065,028 people shows a poor positive correlation between the proportion of Israelis and percentage of population currently divorced or separated in the United States with a correlation coefficient (R) of 0.135 and weighted average of 11.3%, a difference of 1.6%.
Divorced or Separated Correlation Summary
| Measurement | Soviet Union | Israeli |
| Minimum | 3.1% | 2.0% |
| Maximum | 21.3% | 28.2% |
| Range | 18.2% | 26.2% |
| Mean | 11.4% | 10.6% |
| Median | 11.2% | 10.3% |
| Interquartile 25% (IQ1) | 9.9% | 7.8% |
| Interquartile 75% (IQ3) | 13.0% | 11.8% |
| Interquartile Range (IQR) | 3.1% | 3.9% |
| Standard Deviation (Sample) | 3.9% | 5.0% |
| Standard Deviation (Population) | 3.8% | 4.9% |
Demographics Similar to Soviet Union and Israelis by Divorced or Separated
In terms of divorced or separated, the demographic groups most similar to Soviet Union are Immigrants from Egypt (11.1%, a difference of 0.090%), Bhutanese (11.2%, a difference of 0.28%), Chinese (11.2%, a difference of 0.34%), Immigrants from Belarus (11.2%, a difference of 0.35%), and Immigrants from Western Asia (11.2%, a difference of 0.36%). Similarly, the demographic groups most similar to Israelis are Sri Lankan (11.3%, a difference of 0.10%), Immigrants from Vietnam (11.3%, a difference of 0.16%), Immigrants from Philippines (11.3%, a difference of 0.17%), Immigrants from Yemen (11.3%, a difference of 0.23%), and Eastern European (11.3%, a difference of 0.24%).
| Demographics | Rating | Rank | Divorced or Separated |
| Immigrants | Egypt | 100.0 /100 | #39 | Exceptional 11.1% |
| Soviet Union | 100.0 /100 | #40 | Exceptional 11.1% |
| Bhutanese | 100.0 /100 | #41 | Exceptional 11.2% |
| Chinese | 100.0 /100 | #42 | Exceptional 11.2% |
| Immigrants | Belarus | 100.0 /100 | #43 | Exceptional 11.2% |
| Immigrants | Western Asia | 100.0 /100 | #44 | Exceptional 11.2% |
| Turks | 100.0 /100 | #45 | Exceptional 11.2% |
| Laotians | 100.0 /100 | #46 | Exceptional 11.2% |
| Immigrants | Poland | 100.0 /100 | #47 | Exceptional 11.2% |
| Immigrants | Turkey | 100.0 /100 | #48 | Exceptional 11.2% |
| Immigrants | Saudi Arabia | 100.0 /100 | #49 | Exceptional 11.2% |
| Bolivians | 100.0 /100 | #50 | Exceptional 11.2% |
| Immigrants | Bolivia | 100.0 /100 | #51 | Exceptional 11.3% |
| Immigrants | Australia | 99.9 /100 | #52 | Exceptional 11.3% |
| Immigrants | Lithuania | 99.9 /100 | #53 | Exceptional 11.3% |
| Eastern Europeans | 99.9 /100 | #54 | Exceptional 11.3% |
| Immigrants | Yemen | 99.9 /100 | #55 | Exceptional 11.3% |
| Immigrants | Philippines | 99.9 /100 | #56 | Exceptional 11.3% |
| Immigrants | Vietnam | 99.9 /100 | #57 | Exceptional 11.3% |
| Sri Lankans | 99.9 /100 | #58 | Exceptional 11.3% |
| Israelis | 99.9 /100 | #59 | Exceptional 11.3% |