Nonimmigrants vs French American Indian Family Households with Children
COMPARE
Nonimmigrants
French American Indian
Family Households with Children
Family Households with Children Comparison
Nonimmigrants
French American Indians
27.5%
FAMILY HOUSEHOLDS WITH CHILDREN
61.2/ 100
METRIC RATING
166th/ 347
METRIC RANK
26.6%
FAMILY HOUSEHOLDS WITH CHILDREN
0.3/ 100
METRIC RATING
282nd/ 347
METRIC RANK
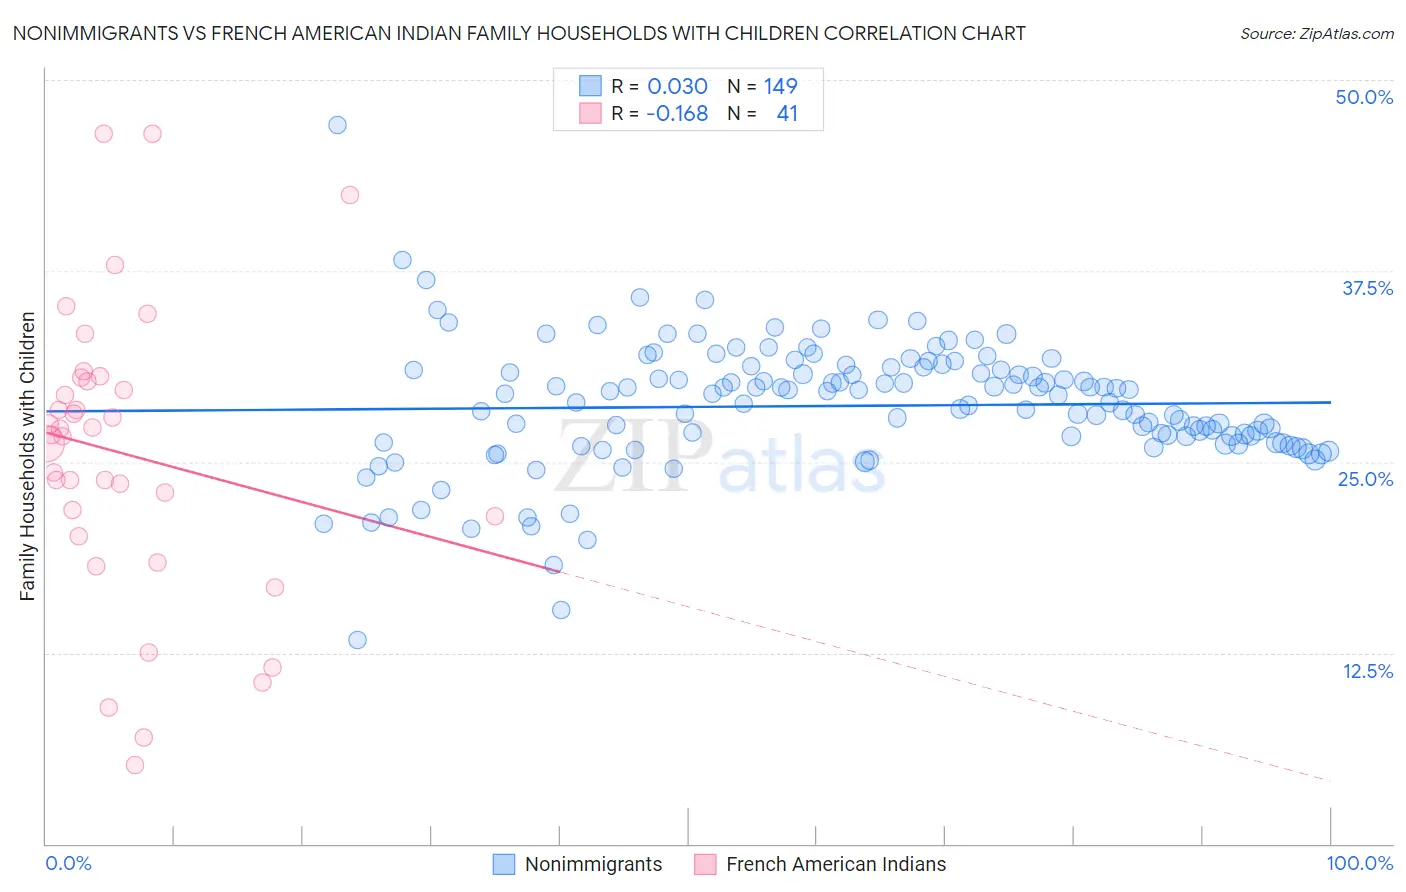
Nonimmigrants vs French American Indian Family Households with Children Correlation Chart
The statistical analysis conducted on geographies consisting of 583,873,030 people shows no correlation between the proportion of Nonimmigrants and percentage of family households with children in the United States with a correlation coefficient (R) of 0.030 and weighted average of 27.5%. Similarly, the statistical analysis conducted on geographies consisting of 131,954,701 people shows a poor negative correlation between the proportion of French American Indians and percentage of family households with children in the United States with a correlation coefficient (R) of -0.168 and weighted average of 26.6%, a difference of 3.6%.
Family Households with Children Correlation Summary
| Measurement | Nonimmigrants | French American Indian |
| Minimum | 13.3% | 5.1% |
| Maximum | 47.1% | 46.5% |
| Range | 33.7% | 41.4% |
| Mean | 28.7% | 25.5% |
| Median | 29.3% | 26.7% |
| Interquartile 25% (IQ1) | 26.2% | 20.8% |
| Interquartile 75% (IQ3) | 31.1% | 30.4% |
| Interquartile Range (IQR) | 4.9% | 9.6% |
| Standard Deviation (Sample) | 4.2% | 9.5% |
| Standard Deviation (Population) | 4.2% | 9.4% |
Similar Demographics by Family Households with Children
Demographics Similar to Nonimmigrants by Family Households with Children
In terms of family households with children, the demographic groups most similar to Nonimmigrants are Immigrants from South Africa (27.5%, a difference of 0.0%), Dominican (27.5%, a difference of 0.0%), Immigrants from Kuwait (27.5%, a difference of 0.010%), Immigrants from Hong Kong (27.5%, a difference of 0.090%), and Czech (27.5%, a difference of 0.10%).
| Demographics | Rating | Rank | Family Households with Children |
| Mongolians | 70.7 /100 | #159 | Good 27.6% |
| Sub-Saharan Africans | 67.5 /100 | #160 | Good 27.6% |
| Alaskan Athabascans | 67.1 /100 | #161 | Good 27.6% |
| Immigrants | Bangladesh | 67.0 /100 | #162 | Good 27.6% |
| Czechs | 65.3 /100 | #163 | Good 27.5% |
| Immigrants | Hong Kong | 64.9 /100 | #164 | Good 27.5% |
| Immigrants | South Africa | 61.3 /100 | #165 | Good 27.5% |
| Immigrants | Nonimmigrants | 61.2 /100 | #166 | Good 27.5% |
| Dominicans | 61.1 /100 | #167 | Good 27.5% |
| Immigrants | Kuwait | 60.9 /100 | #168 | Good 27.5% |
| Seminole | 56.9 /100 | #169 | Average 27.5% |
| Cherokee | 56.7 /100 | #170 | Average 27.5% |
| Blackfeet | 54.3 /100 | #171 | Average 27.5% |
| Israelis | 53.9 /100 | #172 | Average 27.5% |
| Immigrants | Argentina | 52.2 /100 | #173 | Average 27.5% |
Demographics Similar to French American Indians by Family Households with Children
In terms of family households with children, the demographic groups most similar to French American Indians are Lithuanian (26.6%, a difference of 0.010%), Immigrants from North America (26.6%, a difference of 0.070%), Immigrants from Canada (26.5%, a difference of 0.090%), Senegalese (26.6%, a difference of 0.11%), and Cambodian (26.5%, a difference of 0.12%).
| Demographics | Rating | Rank | Family Households with Children |
| Immigrants | Northern Europe | 0.5 /100 | #275 | Tragic 26.7% |
| Immigrants | Spain | 0.5 /100 | #276 | Tragic 26.6% |
| Celtics | 0.4 /100 | #277 | Tragic 26.6% |
| Immigrants | Europe | 0.4 /100 | #278 | Tragic 26.6% |
| Finns | 0.4 /100 | #279 | Tragic 26.6% |
| Senegalese | 0.4 /100 | #280 | Tragic 26.6% |
| Lithuanians | 0.3 /100 | #281 | Tragic 26.6% |
| French American Indians | 0.3 /100 | #282 | Tragic 26.6% |
| Immigrants | North America | 0.3 /100 | #283 | Tragic 26.6% |
| Immigrants | Canada | 0.3 /100 | #284 | Tragic 26.5% |
| Cambodians | 0.2 /100 | #285 | Tragic 26.5% |
| Immigrants | Senegal | 0.2 /100 | #286 | Tragic 26.5% |
| Shoshone | 0.2 /100 | #287 | Tragic 26.5% |
| Russians | 0.2 /100 | #288 | Tragic 26.5% |
| Immigrants | Sweden | 0.2 /100 | #289 | Tragic 26.5% |