West Indian vs Immigrants from Senegal Professional Degree
COMPARE
West Indian
Immigrants from Senegal
Professional Degree
Professional Degree Comparison
West Indians
Immigrants from Senegal
4.1%
PROFESSIONAL DEGREE
9.8/ 100
METRIC RATING
216th/ 347
METRIC RANK
4.5%
PROFESSIONAL DEGREE
68.0/ 100
METRIC RATING
160th/ 347
METRIC RANK
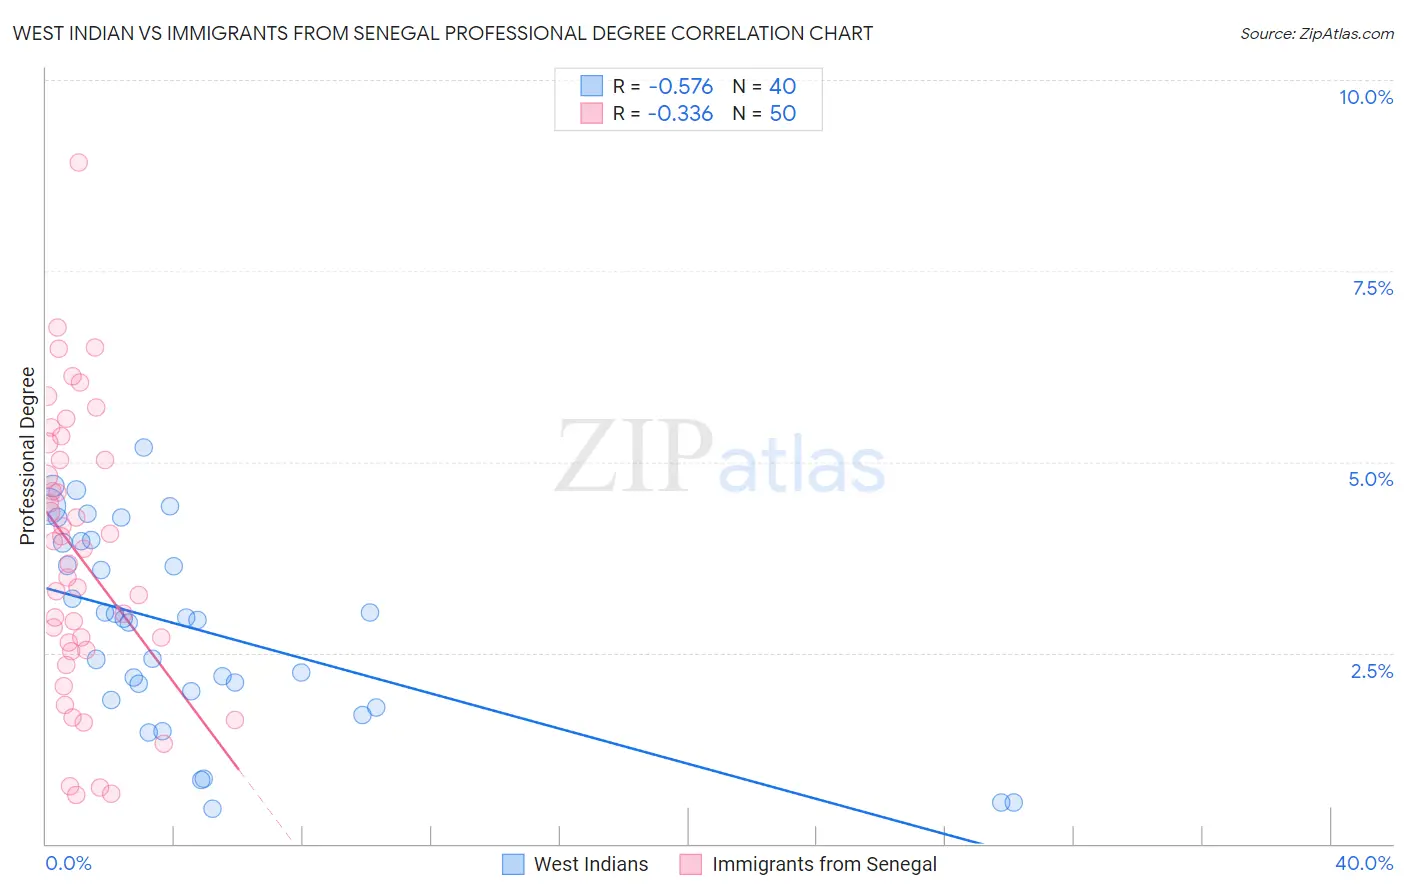
West Indian vs Immigrants from Senegal Professional Degree Correlation Chart
The statistical analysis conducted on geographies consisting of 253,709,742 people shows a substantial negative correlation between the proportion of West Indians and percentage of population with at least professional degree education in the United States with a correlation coefficient (R) of -0.576 and weighted average of 4.1%. Similarly, the statistical analysis conducted on geographies consisting of 90,094,809 people shows a mild negative correlation between the proportion of Immigrants from Senegal and percentage of population with at least professional degree education in the United States with a correlation coefficient (R) of -0.336 and weighted average of 4.5%, a difference of 11.8%.
Professional Degree Correlation Summary
| Measurement | West Indian | Immigrants from Senegal |
| Minimum | 0.46% | 0.65% |
| Maximum | 5.2% | 8.9% |
| Range | 4.7% | 8.3% |
| Mean | 2.8% | 3.8% |
| Median | 2.9% | 3.8% |
| Interquartile 25% (IQ1) | 1.9% | 2.5% |
| Interquartile 75% (IQ3) | 3.9% | 5.0% |
| Interquartile Range (IQR) | 2.0% | 2.5% |
| Standard Deviation (Sample) | 1.3% | 1.8% |
| Standard Deviation (Population) | 1.3% | 1.8% |
Similar Demographics by Professional Degree
Demographics Similar to West Indians by Professional Degree
In terms of professional degree, the demographic groups most similar to West Indians are Immigrants from Vietnam (4.0%, a difference of 0.16%), Portuguese (4.1%, a difference of 0.31%), Immigrants from Ghana (4.1%, a difference of 0.37%), Dutch (4.0%, a difference of 0.37%), and Immigrants from South Eastern Asia (4.0%, a difference of 0.40%).
| Demographics | Rating | Rank | Professional Degree |
| Immigrants | Panama | 12.3 /100 | #209 | Poor 4.1% |
| Immigrants | Nigeria | 11.7 /100 | #210 | Poor 4.1% |
| Germans | 11.6 /100 | #211 | Poor 4.1% |
| Whites/Caucasians | 11.2 /100 | #212 | Poor 4.1% |
| Koreans | 10.7 /100 | #213 | Poor 4.1% |
| Immigrants | Ghana | 10.6 /100 | #214 | Poor 4.1% |
| Portuguese | 10.5 /100 | #215 | Poor 4.1% |
| West Indians | 9.8 /100 | #216 | Tragic 4.1% |
| Immigrants | Vietnam | 9.4 /100 | #217 | Tragic 4.0% |
| Dutch | 9.0 /100 | #218 | Tragic 4.0% |
| Immigrants | South Eastern Asia | 8.9 /100 | #219 | Tragic 4.0% |
| Ute | 8.2 /100 | #220 | Tragic 4.0% |
| French Canadians | 8.0 /100 | #221 | Tragic 4.0% |
| Immigrants | Western Africa | 7.5 /100 | #222 | Tragic 4.0% |
| Immigrants | Bosnia and Herzegovina | 7.4 /100 | #223 | Tragic 4.0% |
Demographics Similar to Immigrants from Senegal by Professional Degree
In terms of professional degree, the demographic groups most similar to Immigrants from Senegal are Vietnamese (4.5%, a difference of 0.060%), Assyrian/Chaldean/Syriac (4.5%, a difference of 0.10%), Immigrants from Armenia (4.5%, a difference of 0.14%), Iraqi (4.5%, a difference of 0.30%), and Swedish (4.5%, a difference of 0.32%).
| Demographics | Rating | Rank | Professional Degree |
| Immigrants | Uruguay | 72.5 /100 | #153 | Good 4.6% |
| Scottish | 71.8 /100 | #154 | Good 4.6% |
| Slavs | 70.8 /100 | #155 | Good 4.5% |
| Swedes | 69.9 /100 | #156 | Good 4.5% |
| Iraqis | 69.8 /100 | #157 | Good 4.5% |
| Immigrants | Armenia | 68.8 /100 | #158 | Good 4.5% |
| Vietnamese | 68.4 /100 | #159 | Good 4.5% |
| Immigrants | Senegal | 68.0 /100 | #160 | Good 4.5% |
| Assyrians/Chaldeans/Syriacs | 67.4 /100 | #161 | Good 4.5% |
| Peruvians | 65.2 /100 | #162 | Good 4.5% |
| Sierra Leoneans | 64.3 /100 | #163 | Good 4.5% |
| Swiss | 61.0 /100 | #164 | Good 4.5% |
| Costa Ricans | 59.9 /100 | #165 | Average 4.5% |
| Immigrants | Colombia | 59.4 /100 | #166 | Average 4.5% |
| Immigrants | Afghanistan | 59.2 /100 | #167 | Average 4.5% |