Icelander vs Immigrants from Senegal Births to Unmarried Women
COMPARE
Icelander
Immigrants from Senegal
Births to Unmarried Women
Births to Unmarried Women Comparison
Icelanders
Immigrants from Senegal
30.3%
BIRTHS TO UNMARRIED WOMEN
86.0/ 100
METRIC RATING
128th/ 347
METRIC RANK
36.7%
BIRTHS TO UNMARRIED WOMEN
0.1/ 100
METRIC RATING
266th/ 347
METRIC RANK
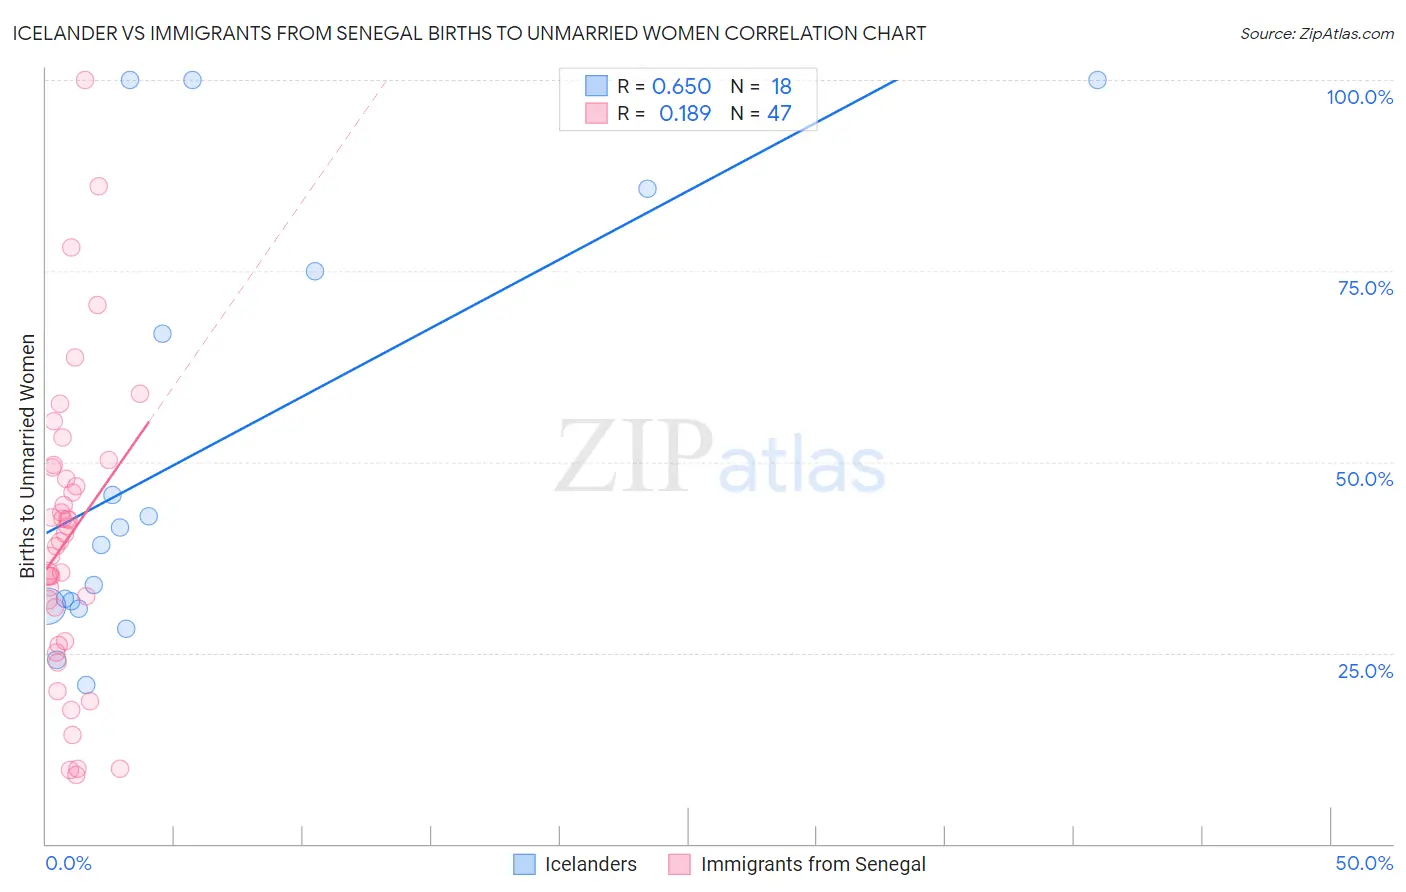
Icelander vs Immigrants from Senegal Births to Unmarried Women Correlation Chart
The statistical analysis conducted on geographies consisting of 153,143,056 people shows a significant positive correlation between the proportion of Icelanders and percentage of births to unmarried women in the United States with a correlation coefficient (R) of 0.650 and weighted average of 30.3%. Similarly, the statistical analysis conducted on geographies consisting of 88,702,422 people shows a poor positive correlation between the proportion of Immigrants from Senegal and percentage of births to unmarried women in the United States with a correlation coefficient (R) of 0.189 and weighted average of 36.7%, a difference of 21.0%.
Births to Unmarried Women Correlation Summary
| Measurement | Icelander | Immigrants from Senegal |
| Minimum | 20.8% | 9.0% |
| Maximum | 100.0% | 100.0% |
| Range | 79.2% | 91.0% |
| Mean | 51.6% | 40.1% |
| Median | 40.2% | 39.5% |
| Interquartile 25% (IQ1) | 31.0% | 26.5% |
| Interquartile 75% (IQ3) | 75.0% | 49.2% |
| Interquartile Range (IQR) | 44.0% | 22.8% |
| Standard Deviation (Sample) | 28.2% | 19.3% |
| Standard Deviation (Population) | 27.4% | 19.1% |
Similar Demographics by Births to Unmarried Women
Demographics Similar to Icelanders by Births to Unmarried Women
In terms of births to unmarried women, the demographic groups most similar to Icelanders are Immigrants from Spain (30.3%, a difference of 0.040%), Immigrants from Bosnia and Herzegovina (30.3%, a difference of 0.050%), Immigrants from Zimbabwe (30.3%, a difference of 0.060%), New Zealander (30.3%, a difference of 0.10%), and Immigrants from Morocco (30.4%, a difference of 0.15%).
| Demographics | Rating | Rank | Births to Unmarried Women |
| Koreans | 88.9 /100 | #121 | Excellent 30.1% |
| Immigrants | Argentina | 88.7 /100 | #122 | Excellent 30.1% |
| Syrians | 88.2 /100 | #123 | Excellent 30.2% |
| Croatians | 88.0 /100 | #124 | Excellent 30.2% |
| Vietnamese | 87.7 /100 | #125 | Excellent 30.2% |
| Europeans | 87.2 /100 | #126 | Excellent 30.2% |
| Chinese | 87.1 /100 | #127 | Excellent 30.2% |
| Icelanders | 86.0 /100 | #128 | Excellent 30.3% |
| Immigrants | Spain | 85.8 /100 | #129 | Excellent 30.3% |
| Immigrants | Bosnia and Herzegovina | 85.7 /100 | #130 | Excellent 30.3% |
| Immigrants | Zimbabwe | 85.7 /100 | #131 | Excellent 30.3% |
| New Zealanders | 85.5 /100 | #132 | Excellent 30.3% |
| Immigrants | Morocco | 85.2 /100 | #133 | Excellent 30.4% |
| Immigrants | South Eastern Asia | 85.2 /100 | #134 | Excellent 30.4% |
| Brazilians | 84.8 /100 | #135 | Excellent 30.4% |
Demographics Similar to Immigrants from Senegal by Births to Unmarried Women
In terms of births to unmarried women, the demographic groups most similar to Immigrants from Senegal are Cherokee (36.7%, a difference of 0.050%), Central American (36.7%, a difference of 0.070%), Comanche (36.7%, a difference of 0.080%), Subsaharan African (36.7%, a difference of 0.10%), and Senegalese (36.8%, a difference of 0.20%).
| Demographics | Rating | Rank | Births to Unmarried Women |
| Immigrants | El Salvador | 0.2 /100 | #259 | Tragic 36.4% |
| Ottawa | 0.2 /100 | #260 | Tragic 36.5% |
| Trinidadians and Tobagonians | 0.2 /100 | #261 | Tragic 36.5% |
| French American Indians | 0.1 /100 | #262 | Tragic 36.6% |
| Nicaraguans | 0.1 /100 | #263 | Tragic 36.6% |
| Sub-Saharan Africans | 0.1 /100 | #264 | Tragic 36.7% |
| Cherokee | 0.1 /100 | #265 | Tragic 36.7% |
| Immigrants | Senegal | 0.1 /100 | #266 | Tragic 36.7% |
| Central Americans | 0.1 /100 | #267 | Tragic 36.7% |
| Comanche | 0.1 /100 | #268 | Tragic 36.7% |
| Senegalese | 0.1 /100 | #269 | Tragic 36.8% |
| Immigrants | Congo | 0.1 /100 | #270 | Tragic 36.8% |
| Immigrants | Barbados | 0.1 /100 | #271 | Tragic 36.8% |
| Choctaw | 0.1 /100 | #272 | Tragic 36.9% |
| Mexicans | 0.1 /100 | #273 | Tragic 36.9% |