Welsh vs Uruguayan Average Family Size
COMPARE
Welsh
Uruguayan
Average Family Size
Average Family Size Comparison
Welsh
Uruguayans
3.12
AVERAGE FAMILY SIZE
0.1/ 100
METRIC RATING
319th/ 347
METRIC RANK
3.23
AVERAGE FAMILY SIZE
58.8/ 100
METRIC RATING
163rd/ 347
METRIC RANK
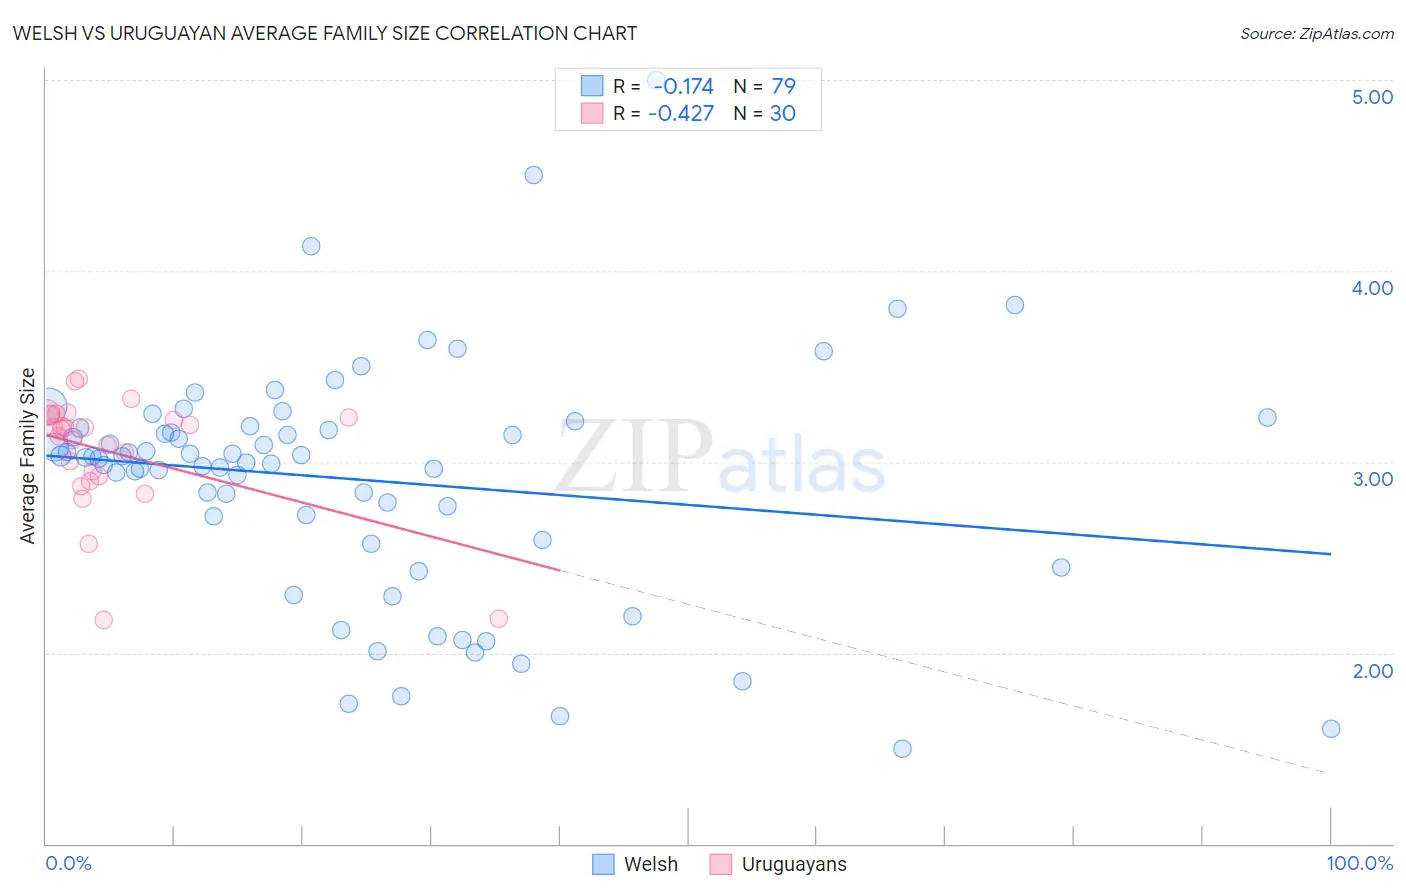
Welsh vs Uruguayan Average Family Size Correlation Chart
The statistical analysis conducted on geographies consisting of 528,179,662 people shows a poor negative correlation between the proportion of Welsh and average family size in the United States with a correlation coefficient (R) of -0.174 and weighted average of 3.12. Similarly, the statistical analysis conducted on geographies consisting of 144,757,082 people shows a moderate negative correlation between the proportion of Uruguayans and average family size in the United States with a correlation coefficient (R) of -0.427 and weighted average of 3.23, a difference of 3.7%.
Average Family Size Correlation Summary
| Measurement | Welsh | Uruguayan |
| Minimum | 1.50 | 2.17 |
| Maximum | 5.00 | 3.44 |
| Range | 3.50 | 1.27 |
| Mean | 2.91 | 3.05 |
| Median | 3.02 | 3.17 |
| Interquartile 25% (IQ1) | 2.59 | 2.92 |
| Interquartile 75% (IQ3) | 3.18 | 3.24 |
| Interquartile Range (IQR) | 0.59 | 0.32 |
| Standard Deviation (Sample) | 0.62 | 0.31 |
| Standard Deviation (Population) | 0.62 | 0.30 |
Similar Demographics by Average Family Size
Demographics Similar to Welsh by Average Family Size
In terms of average family size, the demographic groups most similar to Welsh are Eastern European (3.12, a difference of 0.0%), Italian (3.12, a difference of 0.010%), Serbian (3.12, a difference of 0.070%), Immigrants from North America (3.12, a difference of 0.070%), and Immigrants from Austria (3.12, a difference of 0.10%).
| Demographics | Rating | Rank | Average Family Size |
| Immigrants | Australia | 0.1 /100 | #312 | Tragic 3.13 |
| Bulgarians | 0.1 /100 | #313 | Tragic 3.13 |
| Russians | 0.1 /100 | #314 | Tragic 3.12 |
| Immigrants | Scotland | 0.1 /100 | #315 | Tragic 3.12 |
| Serbians | 0.1 /100 | #316 | Tragic 3.12 |
| Italians | 0.1 /100 | #317 | Tragic 3.12 |
| Eastern Europeans | 0.1 /100 | #318 | Tragic 3.12 |
| Welsh | 0.1 /100 | #319 | Tragic 3.12 |
| Immigrants | North America | 0.0 /100 | #320 | Tragic 3.12 |
| Immigrants | Austria | 0.0 /100 | #321 | Tragic 3.12 |
| Immigrants | Canada | 0.0 /100 | #322 | Tragic 3.12 |
| Soviet Union | 0.0 /100 | #323 | Tragic 3.11 |
| Celtics | 0.0 /100 | #324 | Tragic 3.11 |
| English | 0.0 /100 | #325 | Tragic 3.11 |
| Ottawa | 0.0 /100 | #326 | Tragic 3.11 |
Demographics Similar to Uruguayans by Average Family Size
In terms of average family size, the demographic groups most similar to Uruguayans are Egyptian (3.23, a difference of 0.0%), Ugandan (3.23, a difference of 0.010%), Immigrants from Uganda (3.23, a difference of 0.020%), Immigrants from Senegal (3.23, a difference of 0.030%), and Dutch West Indian (3.23, a difference of 0.040%).
| Demographics | Rating | Rank | Average Family Size |
| Immigrants | Taiwan | 68.1 /100 | #156 | Good 3.24 |
| Immigrants | Uzbekistan | 67.0 /100 | #157 | Good 3.24 |
| Iraqis | 64.3 /100 | #158 | Good 3.24 |
| Ethiopians | 63.9 /100 | #159 | Good 3.24 |
| Immigrants | Iraq | 63.7 /100 | #160 | Good 3.24 |
| Immigrants | Chile | 63.2 /100 | #161 | Good 3.24 |
| Immigrants | Uganda | 60.1 /100 | #162 | Good 3.23 |
| Uruguayans | 58.8 /100 | #163 | Average 3.23 |
| Egyptians | 58.6 /100 | #164 | Average 3.23 |
| Ugandans | 58.4 /100 | #165 | Average 3.23 |
| Immigrants | Senegal | 57.5 /100 | #166 | Average 3.23 |
| Dutch West Indians | 56.9 /100 | #167 | Average 3.23 |
| Taiwanese | 54.2 /100 | #168 | Average 3.23 |
| Aleuts | 54.1 /100 | #169 | Average 3.23 |
| Arabs | 53.8 /100 | #170 | Average 3.23 |