Mexican vs Immigrants from Spain Family Households with Children
COMPARE
Mexican
Immigrants from Spain
Family Households with Children
Family Households with Children Comparison
Mexicans
Immigrants from Spain
31.4%
FAMILY HOUSEHOLDS WITH CHILDREN
100.0/ 100
METRIC RATING
4th/ 347
METRIC RANK
26.6%
FAMILY HOUSEHOLDS WITH CHILDREN
0.5/ 100
METRIC RATING
276th/ 347
METRIC RANK
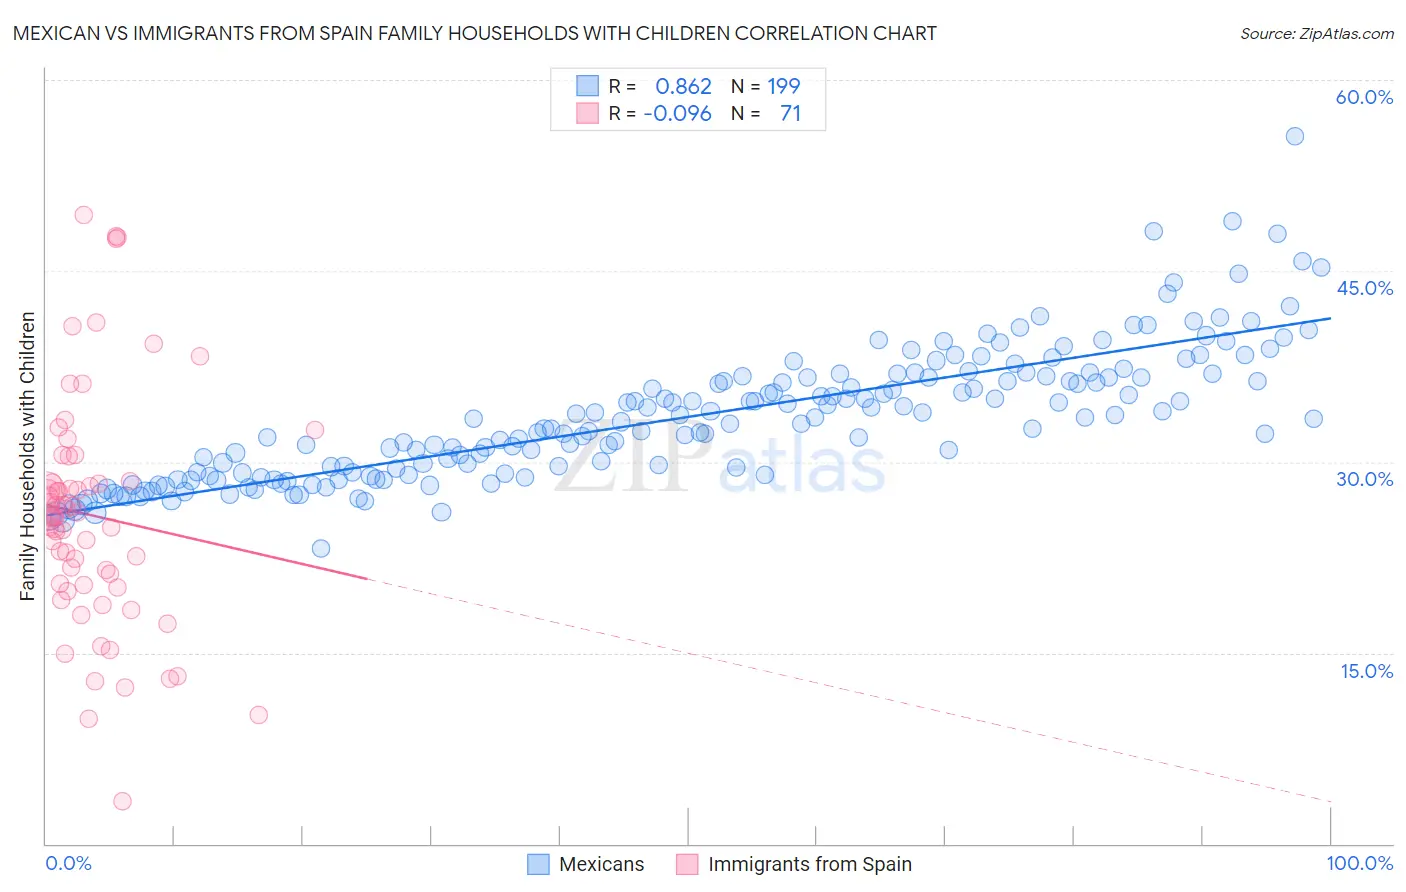
Mexican vs Immigrants from Spain Family Households with Children Correlation Chart
The statistical analysis conducted on geographies consisting of 564,219,663 people shows a very strong positive correlation between the proportion of Mexicans and percentage of family households with children in the United States with a correlation coefficient (R) of 0.862 and weighted average of 31.4%. Similarly, the statistical analysis conducted on geographies consisting of 239,534,267 people shows a slight negative correlation between the proportion of Immigrants from Spain and percentage of family households with children in the United States with a correlation coefficient (R) of -0.096 and weighted average of 26.6%, a difference of 17.7%.
Family Households with Children Correlation Summary
| Measurement | Mexican | Immigrants from Spain |
| Minimum | 23.2% | 3.4% |
| Maximum | 55.6% | 49.4% |
| Range | 32.5% | 46.0% |
| Mean | 33.5% | 25.8% |
| Median | 33.1% | 25.7% |
| Interquartile 25% (IQ1) | 29.1% | 20.3% |
| Interquartile 75% (IQ3) | 36.6% | 28.5% |
| Interquartile Range (IQR) | 7.6% | 8.2% |
| Standard Deviation (Sample) | 5.2% | 9.1% |
| Standard Deviation (Population) | 5.2% | 9.1% |
Similar Demographics by Family Households with Children
Demographics Similar to Mexicans by Family Households with Children
In terms of family households with children, the demographic groups most similar to Mexicans are Tongan (31.2%, a difference of 0.41%), Immigrants from Mexico (31.6%, a difference of 0.78%), Immigrants from India (31.0%, a difference of 1.0%), Immigrants from Central America (31.0%, a difference of 1.3%), and Yakama (30.8%, a difference of 1.9%).
| Demographics | Rating | Rank | Family Households with Children |
| Yup'ik | 100 /100 | #1 | Exceptional 37.0% |
| Inupiat | 100 /100 | #2 | Exceptional 32.8% |
| Immigrants | Mexico | 100.0 /100 | #3 | Exceptional 31.6% |
| Mexicans | 100.0 /100 | #4 | Exceptional 31.4% |
| Tongans | 100.0 /100 | #5 | Exceptional 31.2% |
| Immigrants | India | 100.0 /100 | #6 | Exceptional 31.0% |
| Immigrants | Central America | 100.0 /100 | #7 | Exceptional 31.0% |
| Yakama | 100.0 /100 | #8 | Exceptional 30.8% |
| Thais | 100.0 /100 | #9 | Exceptional 30.6% |
| Immigrants | Fiji | 100.0 /100 | #10 | Exceptional 30.5% |
| Nepalese | 100.0 /100 | #11 | Exceptional 30.5% |
| Immigrants | Pakistan | 100.0 /100 | #12 | Exceptional 30.2% |
| Afghans | 100.0 /100 | #13 | Exceptional 30.2% |
| Bangladeshis | 100.0 /100 | #14 | Exceptional 30.1% |
| Immigrants | South Central Asia | 100.0 /100 | #15 | Exceptional 30.0% |
Demographics Similar to Immigrants from Spain by Family Households with Children
In terms of family households with children, the demographic groups most similar to Immigrants from Spain are Immigrants from Northern Europe (26.7%, a difference of 0.030%), Celtic (26.6%, a difference of 0.080%), Eastern European (26.7%, a difference of 0.11%), Immigrants from Hungary (26.7%, a difference of 0.12%), and Immigrants from Europe (26.6%, a difference of 0.14%).
| Demographics | Rating | Rank | Family Households with Children |
| Immigrants | Denmark | 0.8 /100 | #269 | Tragic 26.7% |
| Immigrants | Zaire | 0.7 /100 | #270 | Tragic 26.7% |
| French | 0.7 /100 | #271 | Tragic 26.7% |
| Somalis | 0.7 /100 | #272 | Tragic 26.7% |
| Immigrants | Hungary | 0.6 /100 | #273 | Tragic 26.7% |
| Eastern Europeans | 0.6 /100 | #274 | Tragic 26.7% |
| Immigrants | Northern Europe | 0.5 /100 | #275 | Tragic 26.7% |
| Immigrants | Spain | 0.5 /100 | #276 | Tragic 26.6% |
| Celtics | 0.4 /100 | #277 | Tragic 26.6% |
| Immigrants | Europe | 0.4 /100 | #278 | Tragic 26.6% |
| Finns | 0.4 /100 | #279 | Tragic 26.6% |
| Senegalese | 0.4 /100 | #280 | Tragic 26.6% |
| Lithuanians | 0.3 /100 | #281 | Tragic 26.6% |
| French American Indians | 0.3 /100 | #282 | Tragic 26.6% |
| Immigrants | North America | 0.3 /100 | #283 | Tragic 26.6% |