Vietnamese vs Chinese Average Family Size
COMPARE
Vietnamese
Chinese
Average Family Size
Average Family Size Comparison
Vietnamese
Chinese
3.37
AVERAGE FAMILY SIZE
100.0/ 100
METRIC RATING
47th/ 347
METRIC RANK
3.34
AVERAGE FAMILY SIZE
100.0/ 100
METRIC RATING
63rd/ 347
METRIC RANK
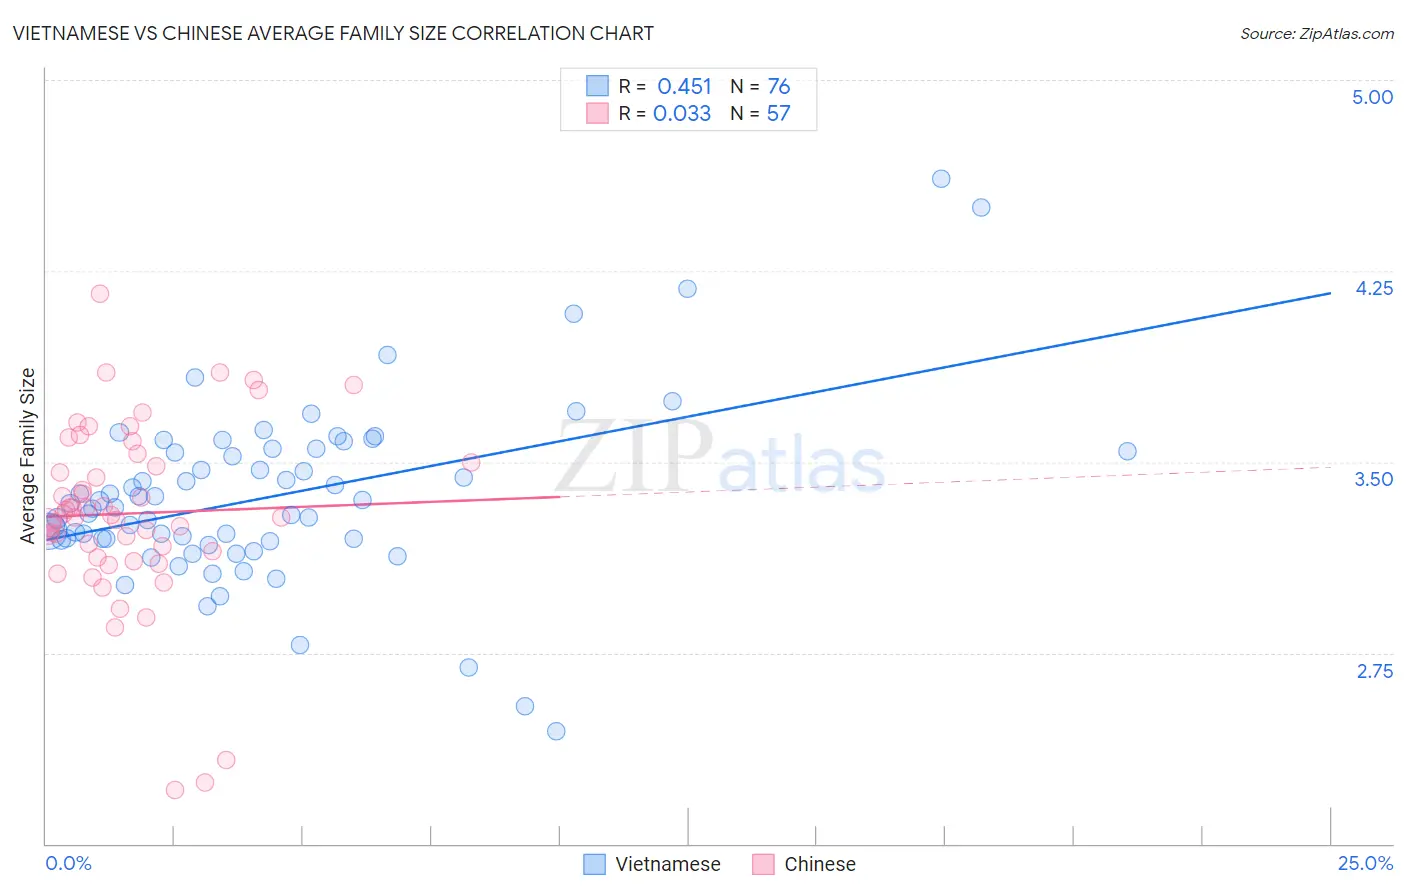
Vietnamese vs Chinese Average Family Size Correlation Chart
The statistical analysis conducted on geographies consisting of 170,658,830 people shows a moderate positive correlation between the proportion of Vietnamese and average family size in the United States with a correlation coefficient (R) of 0.451 and weighted average of 3.37. Similarly, the statistical analysis conducted on geographies consisting of 64,801,575 people shows no correlation between the proportion of Chinese and average family size in the United States with a correlation coefficient (R) of 0.033 and weighted average of 3.34, a difference of 0.90%.
Average Family Size Correlation Summary
| Measurement | Vietnamese | Chinese |
| Minimum | 2.44 | 2.21 |
| Maximum | 4.61 | 4.16 |
| Range | 2.17 | 1.95 |
| Mean | 3.36 | 3.30 |
| Median | 3.33 | 3.29 |
| Interquartile 25% (IQ1) | 3.20 | 3.14 |
| Interquartile 75% (IQ3) | 3.54 | 3.52 |
| Interquartile Range (IQR) | 0.35 | 0.38 |
| Standard Deviation (Sample) | 0.35 | 0.36 |
| Standard Deviation (Population) | 0.35 | 0.36 |
Demographics Similar to Vietnamese and Chinese by Average Family Size
In terms of average family size, the demographic groups most similar to Vietnamese are Immigrants from Nicaragua (3.37, a difference of 0.0%), Haitian (3.37, a difference of 0.040%), Bangladeshi (3.37, a difference of 0.070%), Shoshone (3.37, a difference of 0.10%), and Immigrants from Bangladesh (3.36, a difference of 0.20%). Similarly, the demographic groups most similar to Chinese are Immigrants from Grenada (3.34, a difference of 0.020%), Dominican (3.34, a difference of 0.070%), Immigrants from Laos (3.34, a difference of 0.090%), Central American Indian (3.35, a difference of 0.20%), and Immigrants from Armenia (3.35, a difference of 0.23%).
| Demographics | Rating | Rank | Average Family Size |
| Shoshone | 100.0 /100 | #45 | Exceptional 3.37 |
| Haitians | 100.0 /100 | #46 | Exceptional 3.37 |
| Vietnamese | 100.0 /100 | #47 | Exceptional 3.37 |
| Immigrants | Nicaragua | 100.0 /100 | #48 | Exceptional 3.37 |
| Bangladeshis | 100.0 /100 | #49 | Exceptional 3.37 |
| Immigrants | Bangladesh | 100.0 /100 | #50 | Exceptional 3.36 |
| Nicaraguans | 100.0 /100 | #51 | Exceptional 3.36 |
| Fijians | 100.0 /100 | #52 | Exceptional 3.36 |
| Koreans | 100.0 /100 | #53 | Exceptional 3.36 |
| Immigrants | South Eastern Asia | 100.0 /100 | #54 | Exceptional 3.36 |
| Immigrants | Honduras | 100.0 /100 | #55 | Exceptional 3.36 |
| Immigrants | Dominican Republic | 100.0 /100 | #56 | Exceptional 3.35 |
| Sri Lankans | 100.0 /100 | #57 | Exceptional 3.35 |
| Hondurans | 100.0 /100 | #58 | Exceptional 3.35 |
| Japanese | 100.0 /100 | #59 | Exceptional 3.35 |
| Immigrants | Armenia | 100.0 /100 | #60 | Exceptional 3.35 |
| Central American Indians | 100.0 /100 | #61 | Exceptional 3.35 |
| Immigrants | Grenada | 100.0 /100 | #62 | Exceptional 3.34 |
| Chinese | 100.0 /100 | #63 | Exceptional 3.34 |
| Dominicans | 99.9 /100 | #64 | Exceptional 3.34 |
| Immigrants | Laos | 99.9 /100 | #65 | Exceptional 3.34 |