Venezuelan vs Immigrants from Argentina Married-couple Households
COMPARE
Venezuelan
Immigrants from Argentina
Married-couple Households
Married-couple Households Comparison
Venezuelans
Immigrants from Argentina
47.6%
MARRIED-COUPLE HOUSEHOLDS
93.8/ 100
METRIC RATING
113th/ 347
METRIC RANK
47.2%
MARRIED-COUPLE HOUSEHOLDS
86.0/ 100
METRIC RATING
135th/ 347
METRIC RANK
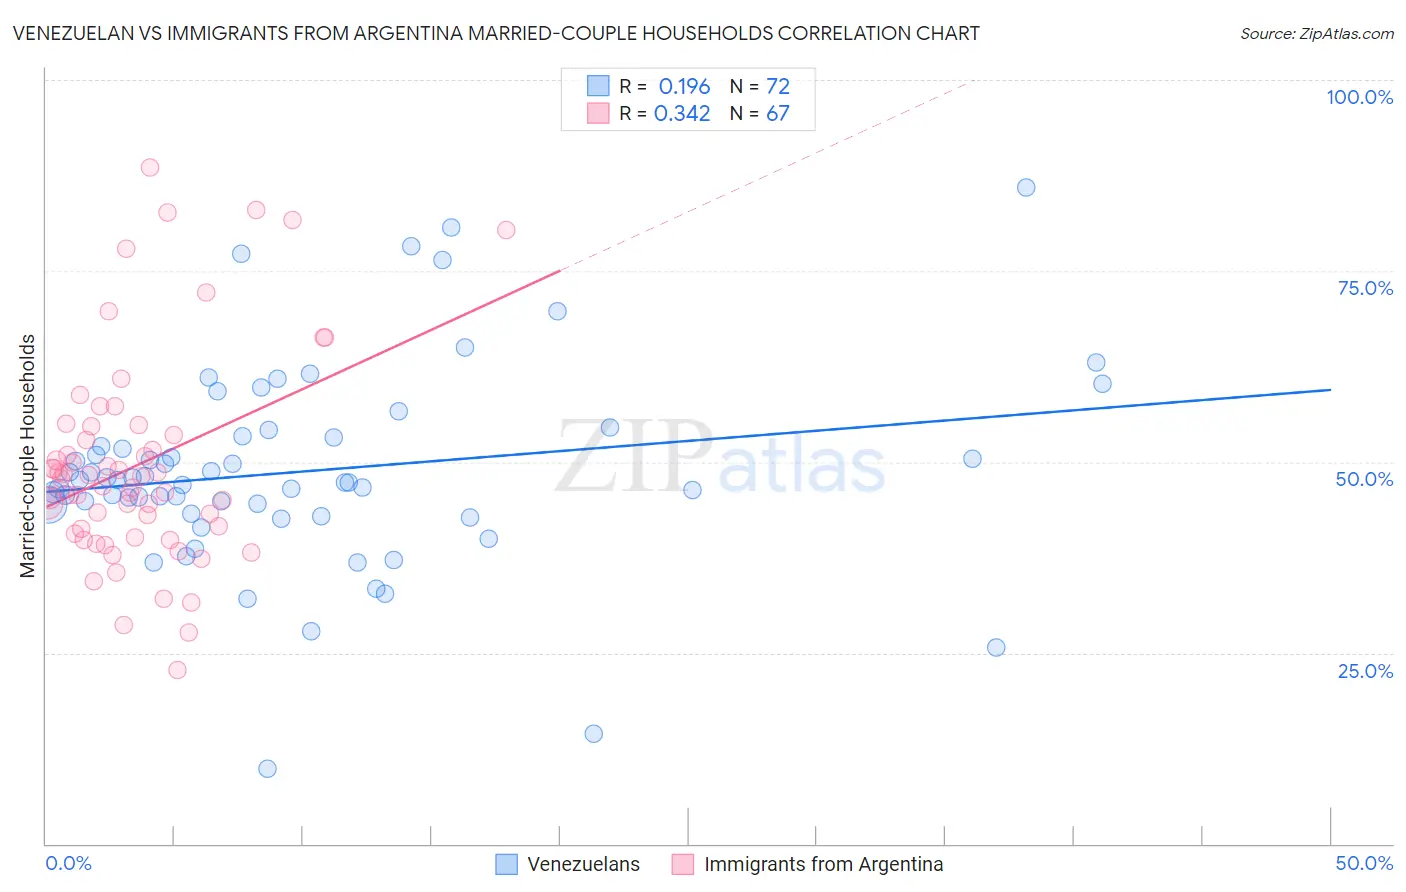
Venezuelan vs Immigrants from Argentina Married-couple Households Correlation Chart
The statistical analysis conducted on geographies consisting of 306,133,854 people shows a poor positive correlation between the proportion of Venezuelans and percentage of married-couple family households in the United States with a correlation coefficient (R) of 0.196 and weighted average of 47.6%. Similarly, the statistical analysis conducted on geographies consisting of 264,359,680 people shows a mild positive correlation between the proportion of Immigrants from Argentina and percentage of married-couple family households in the United States with a correlation coefficient (R) of 0.342 and weighted average of 47.2%, a difference of 0.83%.
Married-couple Households Correlation Summary
| Measurement | Venezuelan | Immigrants from Argentina |
| Minimum | 9.8% | 22.7% |
| Maximum | 86.0% | 88.5% |
| Range | 76.1% | 65.8% |
| Mean | 48.8% | 49.7% |
| Median | 47.4% | 47.9% |
| Interquartile 25% (IQ1) | 43.7% | 40.5% |
| Interquartile 75% (IQ3) | 53.2% | 54.6% |
| Interquartile Range (IQR) | 9.5% | 14.1% |
| Standard Deviation (Sample) | 13.2% | 13.9% |
| Standard Deviation (Population) | 13.1% | 13.8% |
Similar Demographics by Married-couple Households
Demographics Similar to Venezuelans by Married-couple Households
In terms of married-couple households, the demographic groups most similar to Venezuelans are Peruvian (47.6%, a difference of 0.010%), Immigrants from Europe (47.6%, a difference of 0.010%), Syrian (47.6%, a difference of 0.020%), Macedonian (47.6%, a difference of 0.030%), and Immigrants from Jordan (47.7%, a difference of 0.050%).
| Demographics | Rating | Rank | Married-couple Households |
| Portuguese | 95.5 /100 | #106 | Exceptional 47.8% |
| Estonians | 94.7 /100 | #107 | Exceptional 47.7% |
| Immigrants | Japan | 94.4 /100 | #108 | Exceptional 47.7% |
| Immigrants | Jordan | 94.1 /100 | #109 | Exceptional 47.7% |
| Macedonians | 93.9 /100 | #110 | Exceptional 47.6% |
| Syrians | 93.9 /100 | #111 | Exceptional 47.6% |
| Peruvians | 93.8 /100 | #112 | Exceptional 47.6% |
| Venezuelans | 93.8 /100 | #113 | Exceptional 47.6% |
| Immigrants | Europe | 93.7 /100 | #114 | Exceptional 47.6% |
| Slovaks | 92.9 /100 | #115 | Exceptional 47.6% |
| Argentineans | 92.5 /100 | #116 | Exceptional 47.5% |
| French Canadians | 92.4 /100 | #117 | Exceptional 47.5% |
| Immigrants | Germany | 92.4 /100 | #118 | Exceptional 47.5% |
| Chileans | 92.2 /100 | #119 | Exceptional 47.5% |
| Puget Sound Salish | 90.5 /100 | #120 | Exceptional 47.4% |
Demographics Similar to Immigrants from Argentina by Married-couple Households
In terms of married-couple households, the demographic groups most similar to Immigrants from Argentina are Immigrants from Greece (47.2%, a difference of 0.0%), South African (47.3%, a difference of 0.040%), New Zealander (47.2%, a difference of 0.050%), Immigrants from Ukraine (47.3%, a difference of 0.060%), and Immigrants from Malaysia (47.2%, a difference of 0.060%).
| Demographics | Rating | Rank | Married-couple Households |
| Immigrants | Peru | 87.9 /100 | #128 | Excellent 47.3% |
| Immigrants | Iraq | 87.8 /100 | #129 | Excellent 47.3% |
| Immigrants | Hungary | 87.8 /100 | #130 | Excellent 47.3% |
| Immigrants | Denmark | 87.5 /100 | #131 | Excellent 47.3% |
| Immigrants | Ukraine | 86.7 /100 | #132 | Excellent 47.3% |
| South Africans | 86.4 /100 | #133 | Excellent 47.3% |
| Immigrants | Greece | 86.0 /100 | #134 | Excellent 47.2% |
| Immigrants | Argentina | 86.0 /100 | #135 | Excellent 47.2% |
| New Zealanders | 85.3 /100 | #136 | Excellent 47.2% |
| Immigrants | Malaysia | 85.2 /100 | #137 | Excellent 47.2% |
| Immigrants | Afghanistan | 85.1 /100 | #138 | Excellent 47.2% |
| Immigrants | Sweden | 84.7 /100 | #139 | Excellent 47.2% |
| Spanish | 84.5 /100 | #140 | Excellent 47.2% |
| Costa Ricans | 84.4 /100 | #141 | Excellent 47.2% |
| Spaniards | 84.1 /100 | #142 | Excellent 47.2% |