Japanese vs Immigrants from Scotland Single Father Households
COMPARE
Japanese
Immigrants from Scotland
Single Father Households
Single Father Households Comparison
Japanese
Immigrants from Scotland
2.8%
SINGLE FATHER HOUSEHOLDS
0.0/ 100
METRIC RATING
296th/ 347
METRIC RANK
2.1%
SINGLE FATHER HOUSEHOLDS
99.8/ 100
METRIC RATING
76th/ 347
METRIC RANK
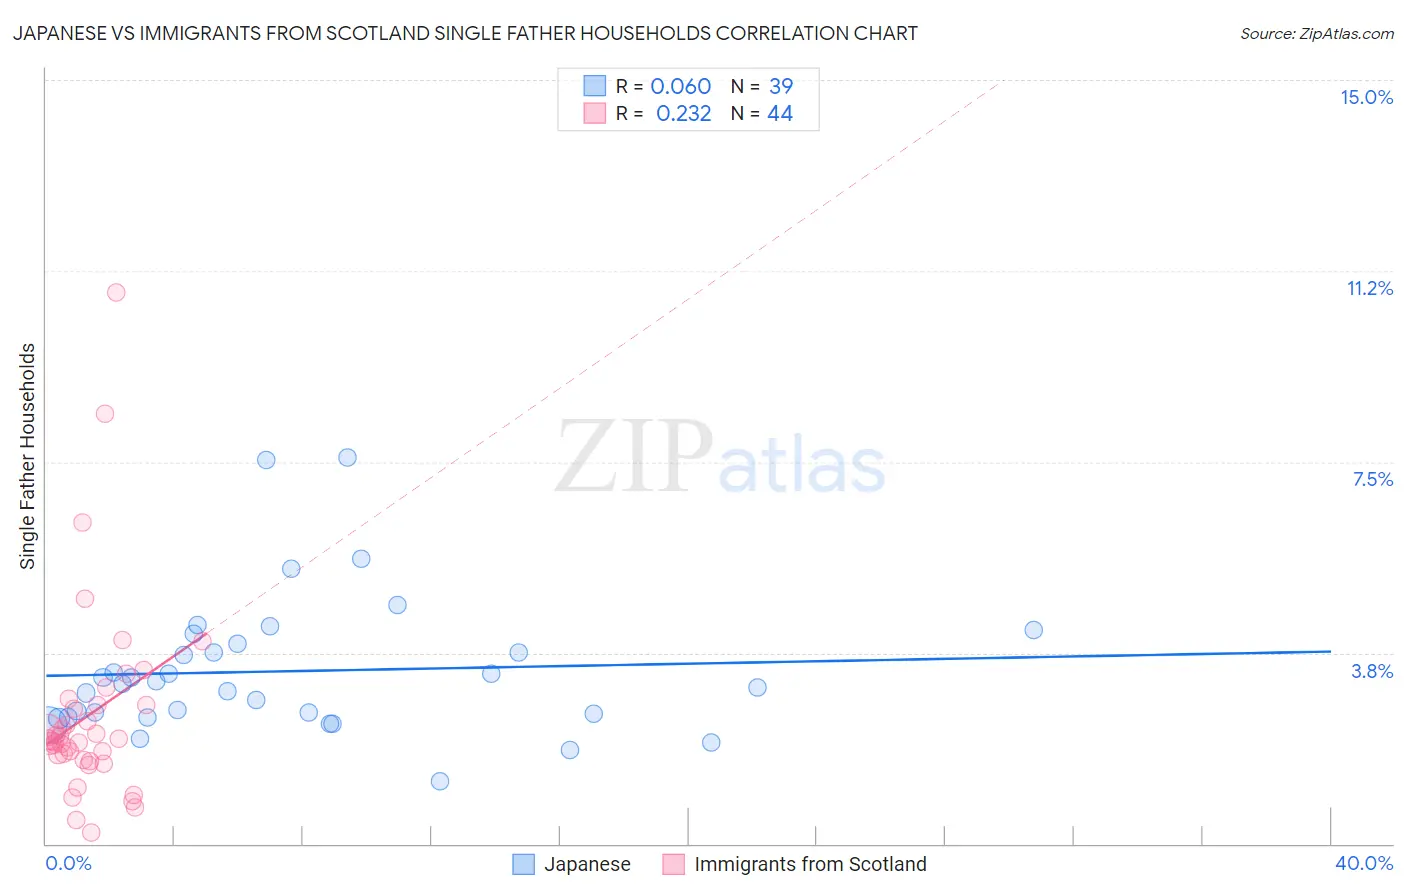
Japanese vs Immigrants from Scotland Single Father Households Correlation Chart
The statistical analysis conducted on geographies consisting of 248,286,499 people shows a slight positive correlation between the proportion of Japanese and percentage of single father households in the United States with a correlation coefficient (R) of 0.060 and weighted average of 2.8%. Similarly, the statistical analysis conducted on geographies consisting of 195,198,580 people shows a weak positive correlation between the proportion of Immigrants from Scotland and percentage of single father households in the United States with a correlation coefficient (R) of 0.232 and weighted average of 2.1%, a difference of 32.5%.
Single Father Households Correlation Summary
| Measurement | Japanese | Immigrants from Scotland |
| Minimum | 1.2% | 0.23% |
| Maximum | 7.6% | 10.8% |
| Range | 6.4% | 10.6% |
| Mean | 3.4% | 2.5% |
| Median | 3.1% | 2.0% |
| Interquartile 25% (IQ1) | 2.5% | 1.7% |
| Interquartile 75% (IQ3) | 3.9% | 2.7% |
| Interquartile Range (IQR) | 1.4% | 1.0% |
| Standard Deviation (Sample) | 1.4% | 1.9% |
| Standard Deviation (Population) | 1.3% | 1.9% |
Similar Demographics by Single Father Households
Demographics Similar to Japanese by Single Father Households
In terms of single father households, the demographic groups most similar to Japanese are Chickasaw (2.8%, a difference of 0.020%), Honduran (2.8%, a difference of 0.080%), Cree (2.8%, a difference of 0.57%), Malaysian (2.7%, a difference of 0.83%), and Lumbee (2.8%, a difference of 0.95%).
| Demographics | Rating | Rank | Single Father Households |
| Tlingit-Haida | 0.0 /100 | #289 | Tragic 2.7% |
| Puget Sound Salish | 0.0 /100 | #290 | Tragic 2.7% |
| Blackfeet | 0.0 /100 | #291 | Tragic 2.7% |
| Choctaw | 0.0 /100 | #292 | Tragic 2.7% |
| Immigrants | Fiji | 0.0 /100 | #293 | Tragic 2.7% |
| Malaysians | 0.0 /100 | #294 | Tragic 2.7% |
| Chickasaw | 0.0 /100 | #295 | Tragic 2.8% |
| Japanese | 0.0 /100 | #296 | Tragic 2.8% |
| Hondurans | 0.0 /100 | #297 | Tragic 2.8% |
| Cree | 0.0 /100 | #298 | Tragic 2.8% |
| Lumbee | 0.0 /100 | #299 | Tragic 2.8% |
| Kiowa | 0.0 /100 | #300 | Tragic 2.8% |
| Immigrants | Latin America | 0.0 /100 | #301 | Tragic 2.8% |
| Spanish Americans | 0.0 /100 | #302 | Tragic 2.8% |
| Immigrants | Honduras | 0.0 /100 | #303 | Tragic 2.8% |
Demographics Similar to Immigrants from Scotland by Single Father Households
In terms of single father households, the demographic groups most similar to Immigrants from Scotland are Immigrants from Sweden (2.1%, a difference of 0.010%), Immigrants from Saudi Arabia (2.1%, a difference of 0.030%), Immigrants from Bangladesh (2.1%, a difference of 0.30%), Immigrants from Egypt (2.1%, a difference of 0.30%), and Estonian (2.1%, a difference of 0.34%).
| Demographics | Rating | Rank | Single Father Households |
| Immigrants | Romania | 99.8 /100 | #69 | Exceptional 2.1% |
| Egyptians | 99.8 /100 | #70 | Exceptional 2.1% |
| Immigrants | Kuwait | 99.8 /100 | #71 | Exceptional 2.1% |
| Immigrants | Spain | 99.8 /100 | #72 | Exceptional 2.1% |
| Immigrants | Bangladesh | 99.8 /100 | #73 | Exceptional 2.1% |
| Immigrants | Egypt | 99.8 /100 | #74 | Exceptional 2.1% |
| Immigrants | Sweden | 99.8 /100 | #75 | Exceptional 2.1% |
| Immigrants | Scotland | 99.8 /100 | #76 | Exceptional 2.1% |
| Immigrants | Saudi Arabia | 99.8 /100 | #77 | Exceptional 2.1% |
| Estonians | 99.7 /100 | #78 | Exceptional 2.1% |
| Immigrants | Asia | 99.7 /100 | #79 | Exceptional 2.1% |
| Immigrants | South Africa | 99.7 /100 | #80 | Exceptional 2.1% |
| Armenians | 99.7 /100 | #81 | Exceptional 2.1% |
| New Zealanders | 99.7 /100 | #82 | Exceptional 2.1% |
| Greeks | 99.7 /100 | #83 | Exceptional 2.1% |